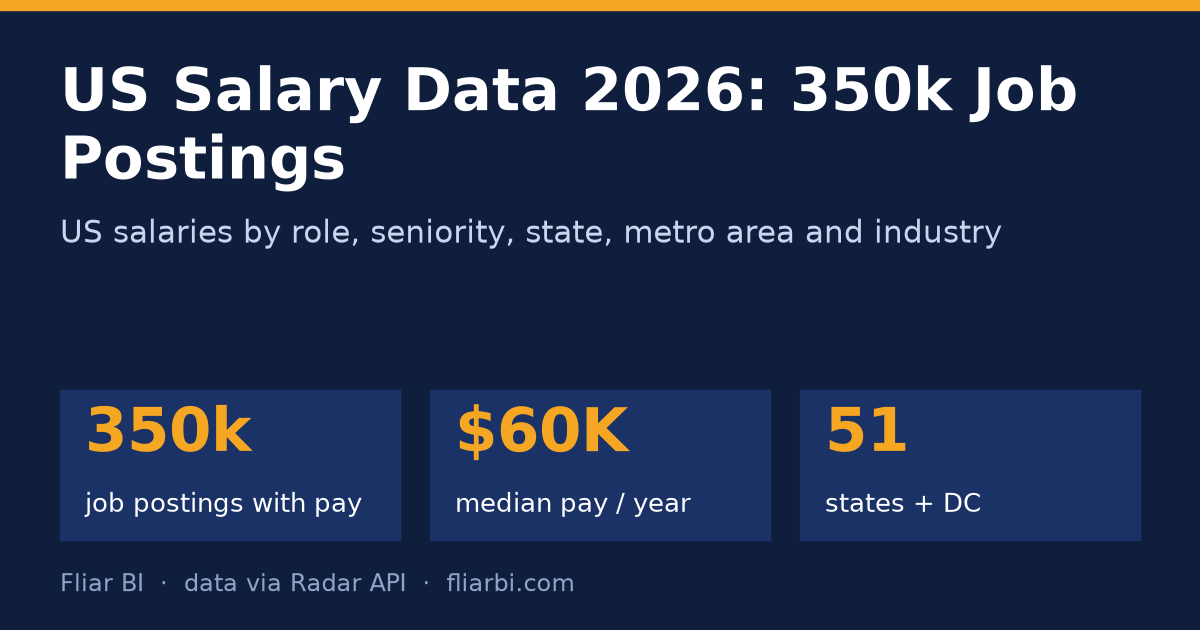
US salary data 2026: 350,000 job postings with posted pay in US$ per year by role, seniority, state, metro area and industry, Jan 2024 to Jun 2026.
How this dataset was acquired. Every row comes from the Radar API, Fliar's company-data API and MCP server. Radar reads
public job postings from job boards and company career pages every day and parses each one into structured fields: title, employer,
location, work mode, experience asked, category and pay. This release keeps the United States postings that state pay, published between
January 2024 and June 2026, removes re-posts of the same job, and annualises every pay figure (hourly, weekly, monthly or annual) to
US dollars per year. It is built for salary benchmarking by role family, seniority, state, metro area, industry and experience. It holds
no job descriptions, application links or recruiter names. Salary statistics for any title, city and skill set, refreshed daily, are served
by POST /v1/jobs/salary-benchmark (reference) or the salary_benchmark MCP tool; the postings themselves by POST /v1/jobs/search.
This file is a 25% sample: 88,798 of 350,328 job postings with pay. It keeps every record for a fixed subset of companies. The subset is chosen by a hash, so it stays the same from one release to the next. The findings and tables below were computed on the full data. For the rest, the withheld fields and monthly updates, get a Radar API key (docs). Each row's
fliar_profile_urlopens the company's full profile on Fliar.
Key findings
- 350,328 US job postings that state pay, from 73,471 employers, posted January 2024 to June 2026 (222,579 in 2026). The median posted pay is $60,000 a year (middle half $41,600 to $97,500).
- 53% of postings quote an hourly rate and 44% an annual salary; hourly postings annualise (× 2,080 hours) to a median $43,680, against $88,000 for annual-salary postings.
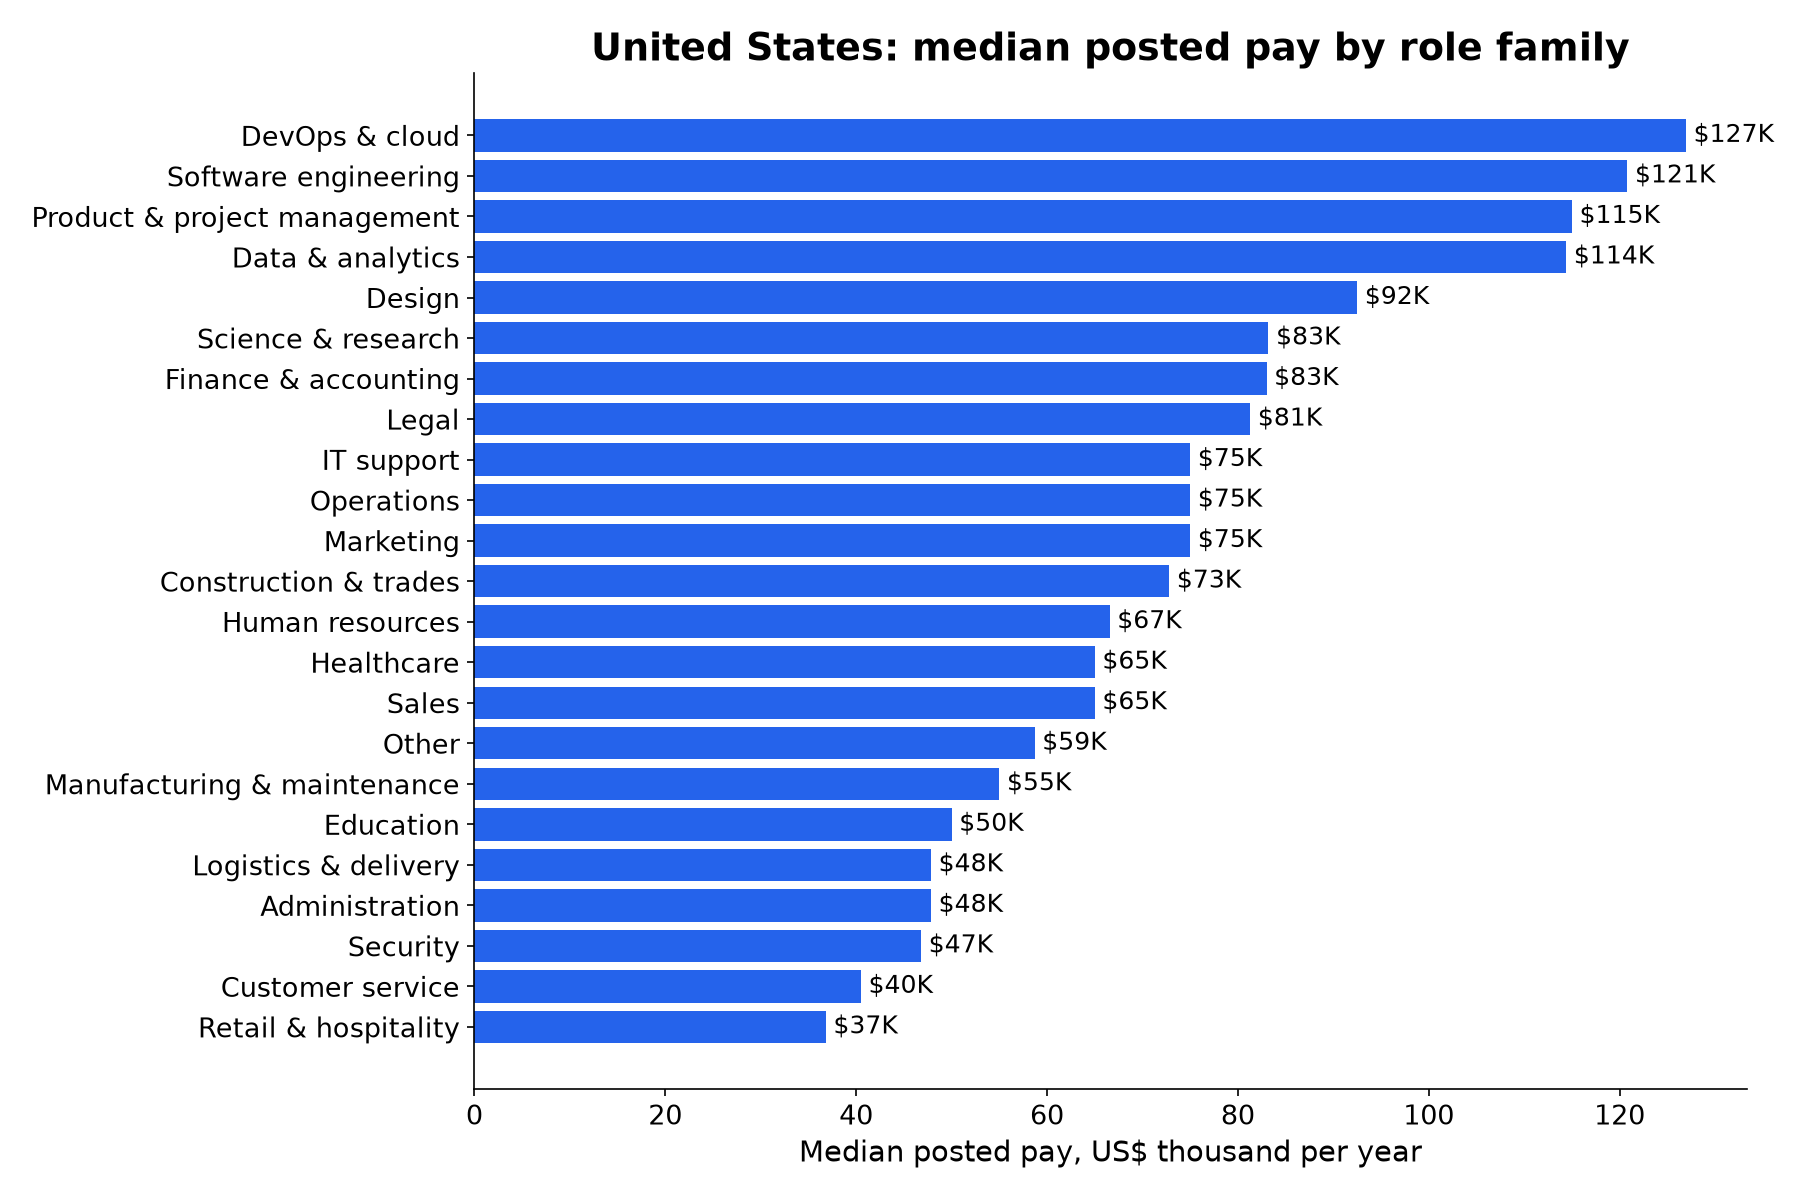
- DevOps & cloud has the highest median ($126,950), then software engineering ($120,805) and product & project management ($115,000); retail & hospitality is lowest ($36,816).
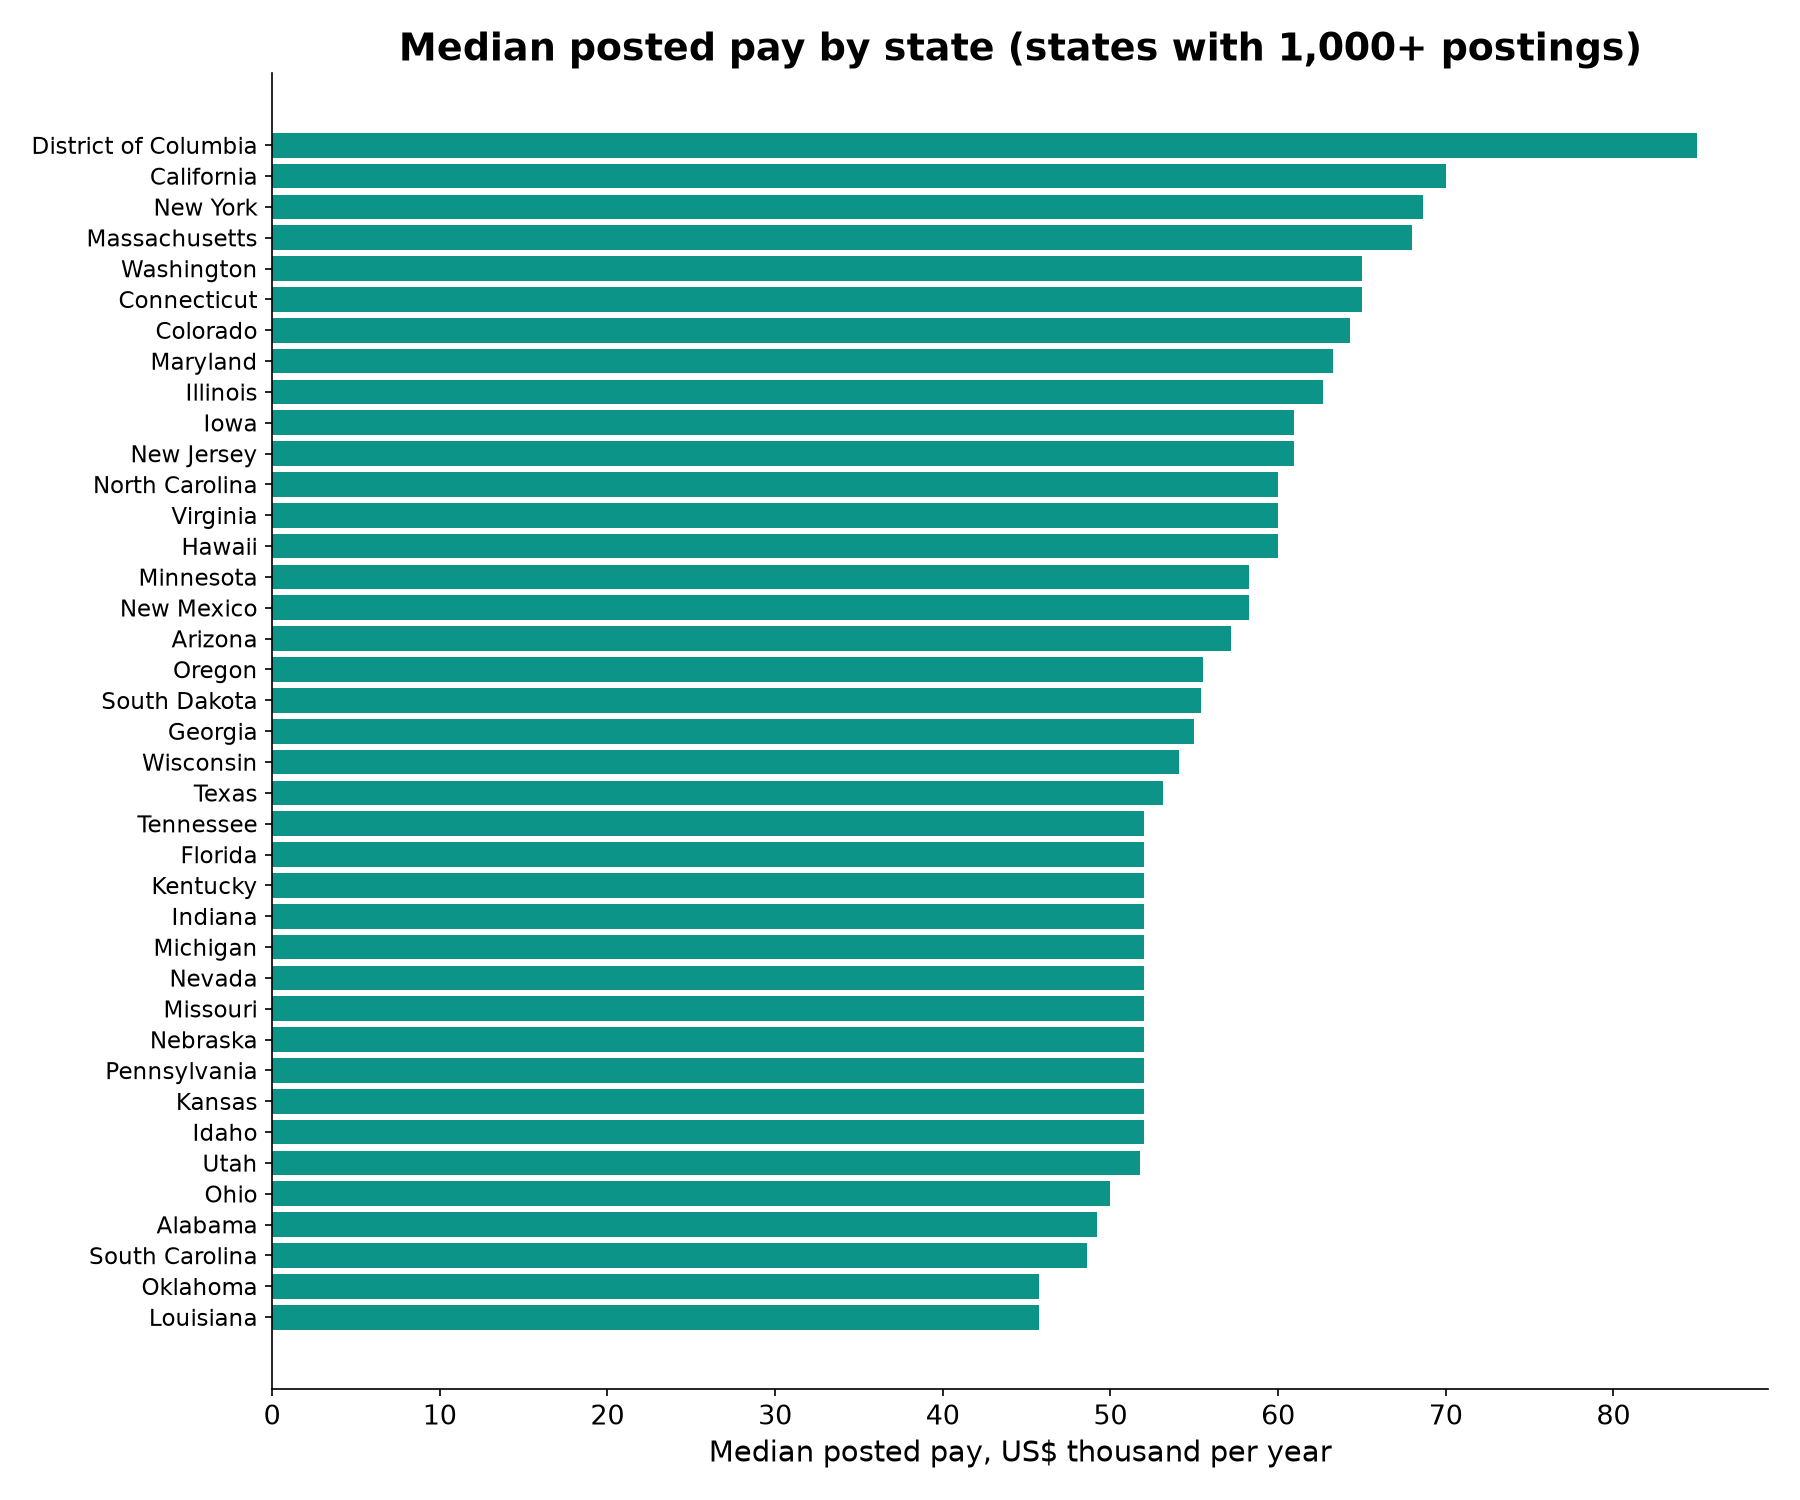
- Highest-paying states (1,000+ postings): District of Columbia ($85,000), California ($70,000) and New York ($68,640); lowest: Oklahoma ($45,760). California holds 22% of postings.
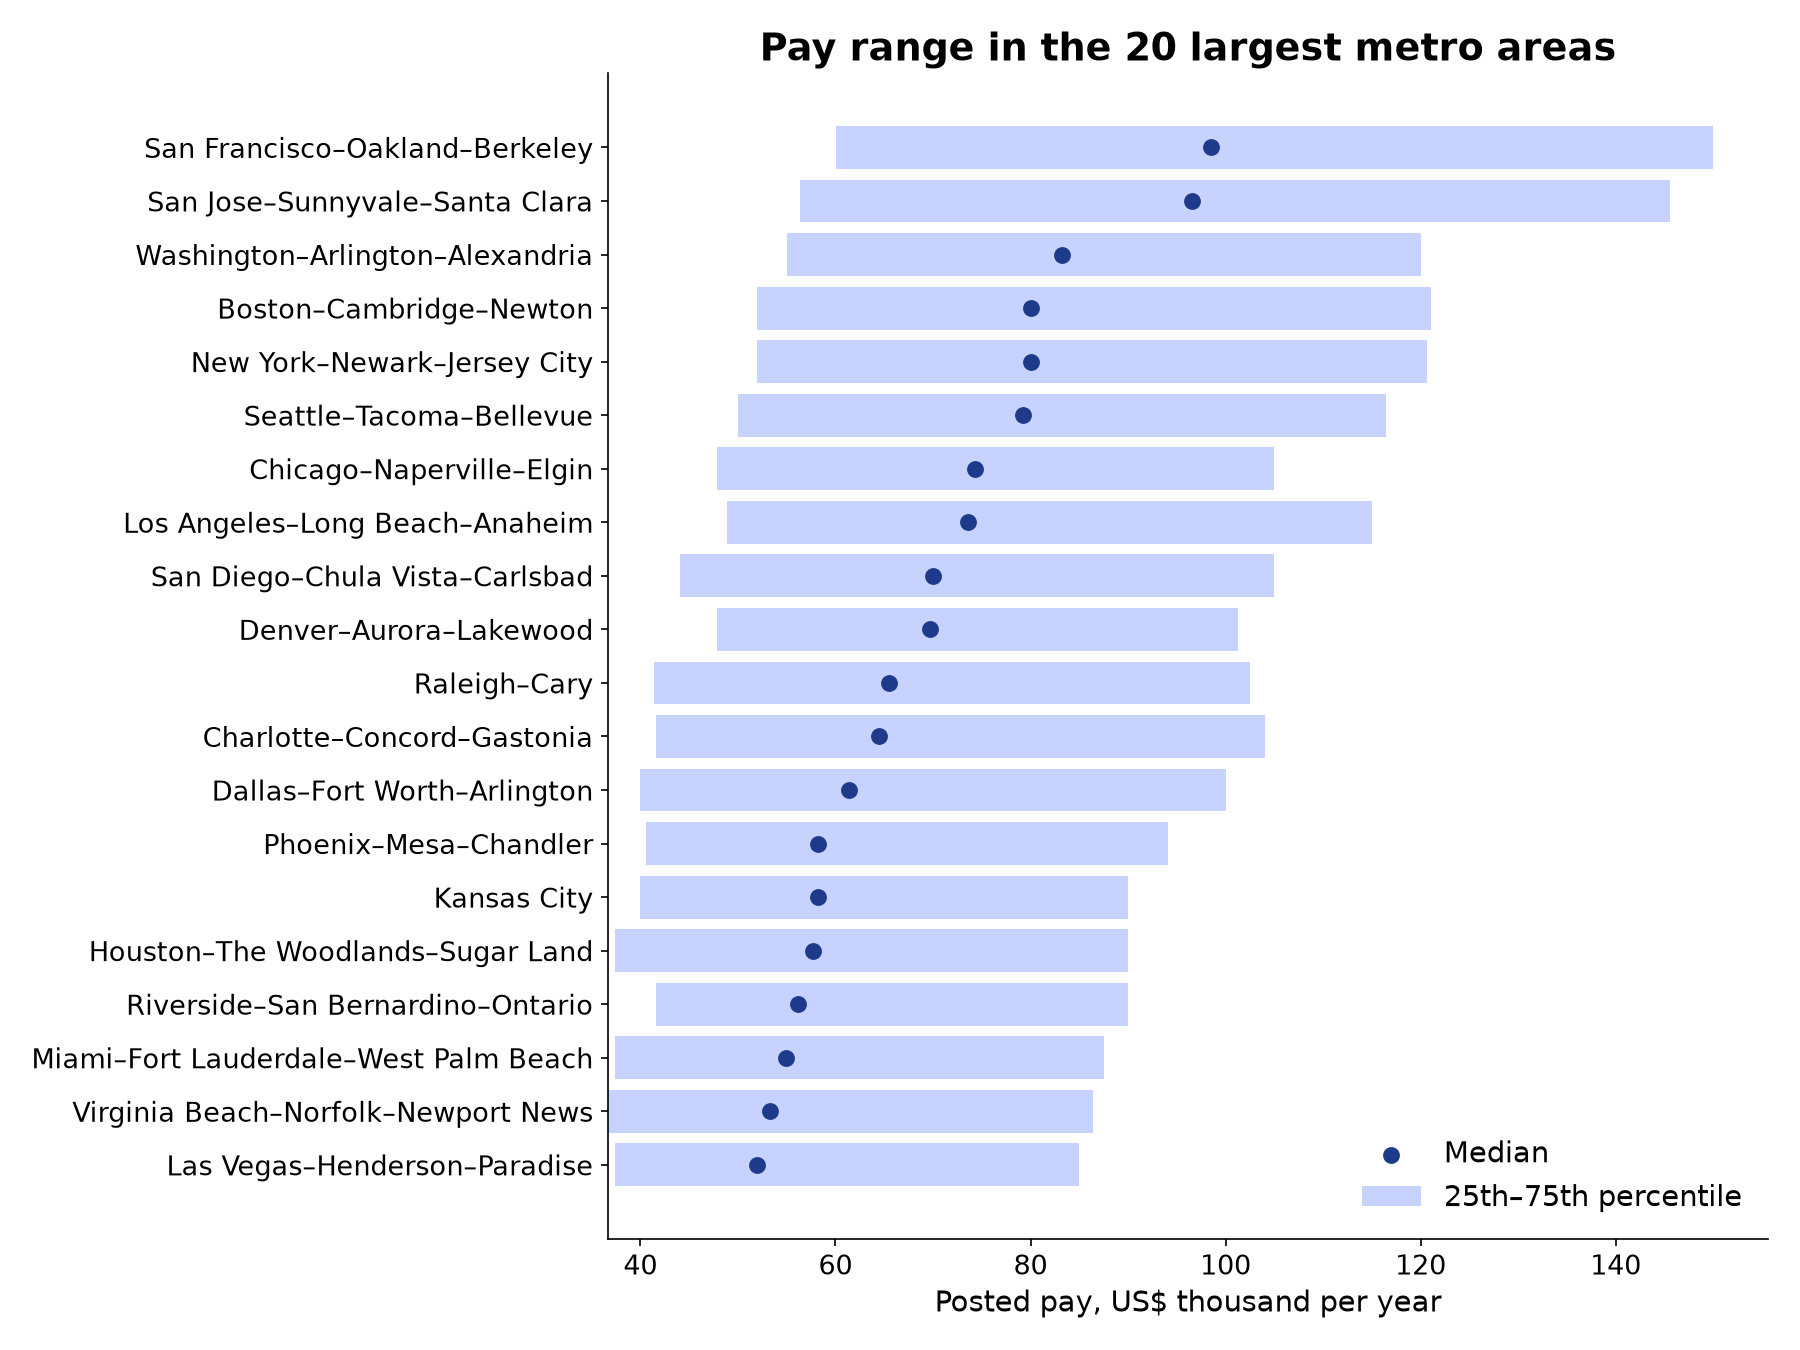
- San Francisco–Oakland–Berkeley is the best-paying large metro (median $98,500), ahead of San Jose–Sunnyvale–Santa Clara ($96,550); Jacksonville is lowest among metros with 1,000+ postings ($49,000).
- Seniority ladder: entry $41,600, mid $70,000, senior $100,000, manager $83,200, director $130,000; remote-marked postings pay a median $88,000 against $59,700 onsite.
US salary percentiles by role family and seniority (US$ per year)
Groups with at least 50 postings. Midpoint of the posted range, annualised.
| Role family | Seniority | Postings | Employers | 10th pct | 25th pct | Median | 75th pct | 90th pct |
|---|---|---|---|---|---|---|---|---|
| Administration | entry | 1,131 | 780 | $32,240 | $37,440 | $41,600 | $52,000 | $65,000 |
| Administration | mid | 305 | 265 | $36,837 | $41,600 | $52,000 | $63,000 | $75,490 |
| Administration | senior | 482 | 385 | $39,550 | $50,000 | $67,040 | $93,900 | $120,001 |
| Administration | lead | 80 | 74 | $36,198 | $42,793 | $55,062 | $93,000 | $125,000 |
| Administration | manager | 603 | 521 | $35,360 | $43,680 | $55,000 | $75,000 | $100,380 |
| Administration | director | 146 | 127 | $41,709 | $55,000 | $88,450 | $130,625 | $165,500 |
| Administration | executive | 80 | 76 | $44,616 | $73,750 | $108,590 | $144,552 | $175,500 |
| Construction & trades | intern | 266 | 206 | $33,280 | $37,440 | $41,600 | $49,920 | $57,252 |
| Construction & trades | entry | 749 | 512 | $35,360 | $39,600 | $47,320 | $62,400 | $80,016 |
| Construction & trades | mid | 1,185 | 763 | $45,000 | $54,080 | $73,000 | $94,500 | $120,000 |
| Construction & trades | senior | 1,175 | 646 | $62,400 | $80,000 | $109,000 | $134,000 | $155,600 |
| Construction & trades | lead | 400 | 289 | $49,920 | $57,200 | $72,800 | $100,000 | $129,190 |
| Construction & trades | manager | 1,052 | 647 | $65,000 | $85,000 | $107,750 | $130,000 | $160,000 |
| Construction & trades | director | 120 | 93 | $89,500 | $130,000 | $156,015 | $180,000 | $200,000 |
| Customer service | entry | 1,780 | 1,249 | $29,120 | $33,280 | $39,520 | $45,760 | $56,160 |
| Customer service | mid | 384 | 302 | $35,360 | $40,836 | $49,400 | $65,000 | $90,000 |
| Customer service | senior | 168 | 140 | $37,440 | $47,221 | $65,700 | $100,000 | $132,616 |
| Customer service | lead | 141 | 115 | $29,120 | $34,840 | $41,600 | $56,160 | $89,600 |
| Customer service | manager | 855 | 698 | $37,440 | $45,760 | $70,000 | $98,080 | $126,634 |
| Customer service | director | 78 | 75 | $66,164 | $86,225 | $141,500 | $176,875 | $220,900 |
| Data & analytics | entry | 178 | 107 | $41,600 | $53,040 | $75,980 | $100,000 | $114,506 |
| Data & analytics | mid | 258 | 199 | $62,047 | $72,800 | $90,000 | $120,480 | $145,600 |
| Data & analytics | senior | 607 | 442 | $80,000 | $96,407 | $122,800 | $149,664 | $175,000 |
| Data & analytics | lead | 232 | 180 | $93,678 | $113,855 | $152,450 | $186,138 | $215,645 |
| Data & analytics | manager | 253 | 203 | $88,540 | $100,000 | $128,000 | $165,000 | $196,500 |
| Data & analytics | director | 115 | 87 | $116,800 | $135,375 | $166,800 | $197,450 | $223,000 |
| Design | entry | 165 | 125 | $41,600 | $50,000 | $63,700 | $73,000 | $88,140 |
| Design | mid | 226 | 160 | $47,694 | $60,000 | $75,000 | $91,448 | $117,825 |
| Design | senior | 495 | 341 | $75,000 | $90,000 | $107,000 | $132,860 | $160,000 |
| Design | lead | 835 | 549 | $80,000 | $110,000 | $140,000 | $167,189 | $197,100 |
| Design | manager | 140 | 119 | $75,000 | $90,000 | $118,822 | $153,188 | $177,975 |
| Design | director | 68 | 61 | $91,400 | $138,300 | $180,000 | $200,000 | $224,806 |
| DevOps & cloud | mid | 74 | 56 | $62,832 | $90,000 | $112,700 | $135,150 | $148,680 |
| DevOps & cloud | senior | 274 | 182 | $84,918 | $100,000 | $122,750 | $145,600 | $174,560 |
| DevOps & cloud | lead | 98 | 78 | $109,760 | $120,000 | $143,475 | $162,435 | $186,210 |
| Education | intern | 80 | 60 | $31,200 | $35,152 | $41,600 | $60,074 | $70,500 |
| Education | entry | 799 | 459 | $31,200 | $34,726 | $41,600 | $56,160 | $96,883 |
| Education | mid | 385 | 263 | $33,280 | $41,600 | $54,080 | $70,829 | $99,299 |
| Education | senior | 163 | 116 | $37,976 | $62,400 | $100,000 | $132,400 | $166,400 |
| Education | lead | 1,567 | 952 | $33,280 | $37,440 | $82,884 | $140,000 | $175,794 |
| Education | manager | 441 | 337 | $37,440 | $46,800 | $66,560 | $92,150 | $125,000 |
| Education | director | 387 | 297 | $37,440 | $47,840 | $66,560 | $100,000 | $139,360 |
| Finance & accounting | intern | 292 | 219 | $34,207 | $39,520 | $50,002 | $62,400 | $79,040 |
| Finance & accounting | entry | 1,568 | 1,131 | $37,440 | $46,875 | $60,000 | $80,000 | $110,000 |
| Finance & accounting | mid | 1,694 | 1,208 | $49,279 | $60,000 | $74,133 | $92,000 | $124,800 |
| Finance & accounting | senior | 3,242 | 1,870 | $63,803 | $76,812 | $90,000 | $110,000 | $143,090 |
| Finance & accounting | lead | 641 | 481 | $53,560 | $62,300 | $80,000 | $105,050 | $151,400 |
| Finance & accounting | manager | 3,175 | 1,790 | $74,542 | $95,000 | $120,000 | $140,000 | $170,000 |
| Finance & accounting | director | 988 | 724 | $92,700 | $120,000 | $150,000 | $180,000 | $204,650 |
| Finance & accounting | executive | 538 | 390 | $96,400 | $130,000 | $160,000 | $197,575 | $225,000 |
| Healthcare | intern | 231 | 143 | $33,000 | $37,440 | $42,640 | $57,980 | $78,328 |
| Healthcare | entry | 5,112 | 2,537 | $33,280 | $37,440 | $45,760 | $69,229 | $105,000 |
| Healthcare | mid | 2,258 | 1,208 | $37,440 | $49,920 | $74,870 | $105,000 | $144,000 |
| Healthcare | senior | 1,014 | 628 | $32,742 | $50,000 | $85,000 | $126,300 | $176,320 |
| Healthcare | lead | 789 | 523 | $37,440 | $49,920 | $79,040 | $124,800 | $150,600 |
| Healthcare | manager | 3,208 | 1,831 | $53,317 | $72,738 | $90,317 | $118,435 | $150,345 |
| Healthcare | director | 1,350 | 908 | $72,450 | $93,150 | $120,000 | $165,000 | $207,945 |
| Healthcare | executive | 134 | 116 | $79,328 | $130,000 | $164,861 | $209,125 | $232,482 |
| Human resources | intern | 89 | 78 | $33,280 | $37,440 | $41,600 | $50,000 | $62,400 |
| Human resources | entry | 427 | 281 | $35,360 | $41,600 | $50,000 | $62,400 | $76,960 |
| Human resources | mid | 471 | 408 | $45,781 | $60,000 | $70,000 | $85,000 | $104,000 |
| Human resources | senior | 412 | 355 | $63,207 | $79,780 | $97,785 | $120,000 | $144,000 |
| Human resources | lead | 79 | 73 | $37,440 | $53,500 | $94,300 | $130,000 | $174,560 |
| Human resources | manager | 596 | 513 | $56,181 | $80,000 | $100,000 | $125,000 | $150,000 |
| Human resources | director | 329 | 287 | $75,000 | $100,000 | $135,000 | $165,000 | $194,200 |
| Human resources | executive | 73 | 69 | $82,783 | $138,550 | $170,000 | $200,000 | $229,200 |
| IT support | entry | 165 | 141 | $35,360 | $41,205 | $50,000 | $61,412 | $76,614 |
| IT support | mid | 346 | 189 | $49,960 | $56,160 | $72,800 | $80,001 | $101,477 |
| IT support | senior | 219 | 161 | $66,860 | $80,948 | $105,000 | $130,000 | $154,386 |
| IT support | lead | 59 | 46 | $63,215 | $86,800 | $110,000 | $145,000 | $164,640 |
| IT support | manager | 139 | 131 | $70,298 | $91,888 | $117,600 | $145,000 | $156,380 |
| IT support | director | 51 | 50 | $114,473 | $137,950 | $151,300 | $180,500 | $200,000 |
| Legal | entry | 515 | 338 | $37,440 | $49,920 | $90,000 | $128,750 | $160,000 |
| Legal | mid | 454 | 297 | $50,000 | $63,708 | $90,000 | $125,900 | $160,000 |
| Legal | senior | 501 | 352 | $62,400 | $83,500 | $120,400 | $160,000 | $190,000 |
| Legal | lead | 90 | 81 | $51,414 | $70,000 | $81,550 | $118,875 | $161,219 |
| Legal | manager | 235 | 208 | $52,000 | $83,350 | $120,000 | $150,000 | $172,080 |
| Legal | director | 131 | 113 | $75,000 | $107,200 | $141,045 | $186,844 | $214,075 |
| Legal | executive | 55 | 50 | $112,548 | $156,250 | $180,000 | $207,000 | $226,771 |
| Logistics & delivery | intern | 140 | 104 | $36,400 | $40,602 | $52,000 | $64,922 | $83,200 |
| Logistics & delivery | entry | 3,386 | 1,544 | $31,200 | $35,360 | $40,560 | $48,097 | $67,600 |
| Logistics & delivery | mid | 455 | 277 | $35,204 | $43,680 | $53,040 | $72,800 | $109,200 |
| Logistics & delivery | senior | 195 | 166 | $48,780 | $67,852 | $90,000 | $113,800 | $146,772 |
| Logistics & delivery | lead | 216 | 187 | $37,440 | $42,796 | $52,000 | $78,500 | $128,725 |
| Logistics & delivery | manager | 777 | 603 | $49,620 | $62,500 | $80,000 | $115,000 | $150,000 |
| Logistics & delivery | director | 99 | 91 | $102,603 | $130,000 | $155,851 | $185,675 | $210,750 |
| Manufacturing & maintenance | intern | 299 | 229 | $35,360 | $39,520 | $45,760 | $54,080 | $70,000 |
| Manufacturing & maintenance | entry | 3,565 | 2,054 | $32,240 | $36,920 | $41,600 | $52,000 | $70,000 |
| Manufacturing & maintenance | mid | 1,543 | 915 | $41,600 | $49,920 | $63,336 | $85,000 | $105,000 |
| Manufacturing & maintenance | senior | 1,957 | 1,054 | $56,947 | $75,200 | $105,000 | $132,400 | $160,000 |
| Manufacturing & maintenance | lead | 691 | 520 | $42,640 | $52,499 | $77,000 | $124,700 | $162,150 |
| Manufacturing & maintenance | manager | 1,312 | 946 | $56,160 | $71,970 | $98,520 | $126,670 | $162,408 |
| Manufacturing & maintenance | director | 171 | 153 | $58,506 | $75,000 | $132,690 | $175,000 | $200,000 |
| Manufacturing & maintenance | executive | 69 | 60 | $53,184 | $82,500 | $138,156 | $187,500 | $212,368 |
| Marketing | intern | 243 | 217 | $25,054 | $31,200 | $37,440 | $42,505 | $52,000 |
| Marketing | entry | 760 | 475 | $33,280 | $41,600 | $50,000 | $59,888 | $75,000 |
| Marketing | mid | 889 | 640 | $45,752 | $60,000 | $75,000 | $93,600 | $124,840 |
| Marketing | senior | 689 | 517 | $60,800 | $75,000 | $95,000 | $125,174 | $154,840 |
| Marketing | lead | 198 | 170 | $52,000 | $80,000 | $120,000 | $150,000 | $185,810 |
| Marketing | manager | 1,885 | 1,432 | $56,000 | $75,000 | $95,000 | $123,000 | $151,880 |
| Marketing | director | 918 | 711 | $73,154 | $100,000 | $132,500 | $167,824 | $200,000 |
| Marketing | executive | 174 | 147 | $101,350 | $140,000 | $170,000 | $200,000 | $235,250 |
| Operations | intern | 176 | 130 | $33,280 | $40,092 | $47,840 | $55,000 | $69,500 |
| Operations | entry | 1,010 | 678 | $31,200 | $37,440 | $45,760 | $61,470 | $80,000 |
| Operations | mid | 1,957 | 1,397 | $45,760 | $55,000 | $70,000 | $91,000 | $115,000 |
| Operations | senior | 1,473 | 923 | $67,813 | $83,100 | $106,522 | $130,000 | $158,060 |
| Operations | lead | 831 | 590 | $40,560 | $52,000 | $86,800 | $120,000 | $154,700 |
| Operations | manager | 7,990 | 4,292 | $43,680 | $59,285 | $81,186 | $112,200 | $143,000 |
| Operations | director | 1,538 | 1,097 | $65,000 | $95,000 | $132,900 | $170,000 | $200,000 |
| Operations | executive | 250 | 217 | $60,288 | $115,000 | $169,940 | $200,000 | $226,106 |
| Other | intern | 923 | 707 | $31,200 | $35,360 | $41,600 | $52,000 | $69,763 |
| Other | entry | 4,891 | 2,981 | $31,200 | $35,360 | $42,650 | $60,000 | $83,721 |
| Other | mid | 433 | 343 | $31,408 | $40,000 | $52,000 | $68,900 | $90,000 |
| Other | senior | 2,872 | 1,778 | $52,909 | $75,000 | $96,260 | $124,687 | $150,000 |
| Other | lead | 1,648 | 1,243 | $32,404 | $39,520 | $60,819 | $120,000 | $158,176 |
| Other | manager | 10,640 | 6,392 | $37,440 | $49,920 | $70,187 | $104,000 | $140,000 |
| Other | director | 4,101 | 2,968 | $50,000 | $79,040 | $120,000 | $166,000 | $200,000 |
| Other | executive | 1,090 | 870 | $70,000 | $118,766 | $151,250 | $193,375 | $225,000 |
| Product & project management | entry | 53 | 22 | $48,922 | $52,000 | $72,800 | $93,600 | $93,600 |
| Product & project management | mid | 267 | 235 | $63,263 | $80,000 | $107,400 | $135,200 | $164,128 |
| Product & project management | senior | 422 | 330 | $90,000 | $118,363 | $140,000 | $166,400 | $193,800 |
| Product & project management | lead | 178 | 136 | $85,600 | $121,200 | $148,448 | $179,650 | $208,472 |
| Product & project management | manager | 3,410 | 2,154 | $65,000 | $85,000 | $110,000 | $137,500 | $165,602 |
| Product & project management | director | 140 | 124 | $120,360 | $145,950 | $175,000 | $201,661 | $225,500 |
| Retail & hospitality | intern | 170 | 65 | $27,040 | $33,280 | $39,260 | $48,880 | $62,369 |
| Retail & hospitality | entry | 5,988 | 2,271 | $24,960 | $30,160 | $34,320 | $37,856 | $43,680 |
| Retail & hospitality | mid | 1,277 | 726 | $31,200 | $35,360 | $43,680 | $55,000 | $75,000 |
| Retail & hospitality | senior | 110 | 79 | $31,200 | $34,320 | $47,778 | $79,751 | $107,050 |
| Retail & hospitality | lead | 796 | 433 | $28,080 | $32,240 | $37,440 | $43,680 | $52,000 |
| Retail & hospitality | manager | 4,122 | 1,881 | $33,280 | $37,960 | $48,880 | $64,888 | $80,170 |
| Retail & hospitality | director | 173 | 139 | $36,618 | $52,000 | $80,000 | $115,000 | $154,350 |
| Retail & hospitality | executive | 72 | 61 | $32,831 | $35,360 | $73,500 | $101,250 | $138,636 |
| Sales | intern | 359 | 180 | $27,032 | $35,480 | $45,000 | $52,378 | $104,200 |
| Sales | entry | 4,553 | 2,454 | $29,120 | $33,280 | $41,600 | $60,146 | $84,970 |
| Sales | mid | 1,724 | 1,127 | $45,000 | $57,300 | $74,447 | $100,000 | $143,790 |
| Sales | senior | 1,067 | 699 | $52,000 | $75,000 | $100,000 | $128,080 | $160,000 |
| Sales | lead | 401 | 286 | $31,200 | $39,520 | $60,601 | $129,000 | $170,000 |
| Sales | manager | 5,757 | 3,607 | $42,000 | $55,000 | $75,050 | $110,000 | $150,000 |
| Sales | director | 1,127 | 870 | $70,000 | $100,000 | $132,500 | $170,000 | $200,000 |
| Sales | executive | 262 | 212 | $100,000 | $120,125 | $152,900 | $184,625 | $224,500 |
| Science & research | intern | 68 | 52 | $31,200 | $37,440 | $46,800 | $70,522 | $104,000 |
| Science & research | entry | 298 | 189 | $33,784 | $43,885 | $55,000 | $73,512 | $106,710 |
| Science & research | mid | 133 | 107 | $48,401 | $57,500 | $72,000 | $90,000 | $133,260 |
| Science & research | senior | 389 | 281 | $62,376 | $84,150 | $110,000 | $144,100 | $170,500 |
| Science & research | lead | 101 | 76 | $52,000 | $70,000 | $95,000 | $150,000 | $170,000 |
| Science & research | manager | 108 | 99 | $65,000 | $78,811 | $96,700 | $115,627 | $153,752 |
| Science & research | director | 154 | 122 | $100,000 | $132,233 | $167,250 | $205,615 | $226,185 |
| Security | entry | 124 | 97 | $33,280 | $37,336 | $41,600 | $53,040 | $80,000 |
| Security | mid | 131 | 103 | $41,704 | $52,150 | $77,904 | $99,840 | $134,100 |
| Security | senior | 225 | 167 | $67,900 | $85,910 | $108,895 | $140,000 | $162,696 |
| Security | lead | 135 | 122 | $65,924 | $105,956 | $132,900 | $165,476 | $182,623 |
| Security | manager | 162 | 139 | $49,920 | $90,000 | $129,250 | $165,400 | $184,660 |
| Security | director | 55 | 53 | $75,534 | $120,000 | $149,000 | $196,085 | $214,000 |
| Software engineering | intern | 60 | 53 | $39,338 | $45,075 | $52,000 | $70,720 | $83,200 |
| Software engineering | entry | 265 | 186 | $41,760 | $65,000 | $83,300 | $100,000 | $115,000 |
| Software engineering | mid | 378 | 225 | $65,000 | $82,100 | $110,120 | $140,000 | $166,880 |
| Software engineering | senior | 1,614 | 858 | $87,614 | $106,000 | $130,000 | $158,975 | $182,000 |
| Software engineering | lead | 730 | 442 | $98,000 | $116,550 | $149,265 | $180,000 | $209,066 |
| Software engineering | manager | 534 | 390 | $81,176 | $111,679 | $140,393 | $171,512 | $204,850 |
| Software engineering | director | 179 | 151 | $119,700 | $150,700 | $180,000 | $212,500 | $225,600 |
| Software engineering | executive | 52 | 46 | $107,375 | $135,000 | $171,550 | $209,222 | $230,000 |
US salaries by state (all states)
Sorted by number of postings.
| State | Postings | Employers | 10th pct | 25th pct | Median | 75th pct | 90th pct | Hourly share | Top city |
|---|---|---|---|---|---|---|---|---|---|
| California | 75,912 | 19,495 | $37,440 | $45,760 | $70,000 | $112,597 | $156,000 | 53.8% | Los Angeles |
| Texas | 28,850 | 9,850 | $29,120 | $36,035 | $53,145 | $90,000 | $130,000 | 55.1% | Houston |
| Colorado | 18,397 | 6,600 | $37,440 | $44,304 | $64,272 | $97,000 | $135,000 | 49.6% | Denver |
| New York | 18,215 | 6,920 | $36,417 | $45,000 | $68,640 | $104,000 | $150,000 | 45.5% | New York |
| Florida | 17,270 | 6,818 | $31,200 | $37,440 | $52,000 | $83,200 | $124,800 | 56.0% | Orlando |
| Arizona | 14,849 | 5,379 | $33,280 | $40,000 | $57,200 | $92,560 | $132,400 | 55.4% | Phoenix |
| Illinois | 14,609 | 5,660 | $34,320 | $41,600 | $62,700 | $95,784 | $132,142 | 47.5% | Chicago |
| Massachusetts | 13,798 | 4,817 | $37,440 | $45,313 | $67,998 | $103,000 | $146,000 | 50.1% | Boston |
| North Carolina | 12,775 | 4,995 | $31,200 | $39,187 | $60,000 | $97,521 | $140,000 | 52.1% | Charlotte |
| Washington | 11,021 | 4,047 | $38,438 | $45,760 | $65,000 | $100,734 | $143,520 | 56.3% | Seattle |
| Virginia | 8,439 | 3,547 | $31,200 | $39,520 | $60,000 | $99,000 | $140,000 | 50.6% | Virginia Beach |
| New Jersey | 8,113 | 3,526 | $35,360 | $41,600 | $60,940 | $99,528 | $140,000 | 55.0% | Newark |
| Indiana | 6,636 | 2,909 | $31,200 | $37,440 | $52,000 | $86,500 | $125,000 | 56.0% | Indianapolis |
| Ohio | 6,584 | 3,125 | $31,200 | $37,440 | $50,000 | $80,000 | $115,000 | 57.8% | Columbus |
| Missouri | 6,135 | 2,713 | $31,720 | $37,440 | $52,000 | $81,120 | $119,300 | 57.5% | Kansas City |
| Connecticut | 5,740 | 2,415 | $35,755 | $41,600 | $65,000 | $103,085 | $146,500 | 48.0% | Hartford |
| Tennessee | 5,477 | 2,710 | $31,200 | $37,440 | $52,000 | $83,200 | $122,512 | 53.9% | Memphis |
| Michigan | 5,412 | 2,576 | $31,200 | $37,440 | $52,000 | $83,200 | $120,000 | 57.7% | Detroit |
| Georgia | 5,080 | 2,600 | $29,120 | $37,440 | $55,000 | $90,000 | $127,500 | 52.1% | Atlanta |
| Pennsylvania | 4,867 | 2,446 | $31,200 | $37,960 | $52,000 | $83,200 | $120,000 | 55.2% | Philadelphia |
| Minnesota | 4,506 | 2,071 | $34,320 | $41,600 | $58,240 | $85,000 | $125,000 | 52.0% | Minneapolis |
| Nevada | 4,423 | 2,281 | $31,200 | $37,440 | $52,000 | $83,280 | $125,000 | 58.2% | Las Vegas |
| Oregon | 4,386 | 1,989 | $36,067 | $41,600 | $55,500 | $87,000 | $124,800 | 59.6% | Portland |
| Utah | 4,378 | 2,022 | $31,200 | $37,440 | $51,740 | $84,080 | $124,800 | 59.8% | Salt Lake City |
| Kansas | 4,070 | 1,842 | $31,200 | $37,440 | $52,000 | $83,200 | $120,000 | 59.8% | Overland Park |
| Iowa | 3,453 | 1,580 | $32,760 | $40,560 | $60,944 | $94,348 | $124,800 | 48.2% | Iowa City |
| District of Columbia | 3,290 | 1,774 | $41,600 | $58,455 | $85,000 | $123,375 | $164,100 | 31.2% | Washington |
| Maryland | 3,268 | 1,665 | $33,781 | $41,600 | $63,275 | $96,000 | $135,000 | 52.3% | Baltimore |
| Wisconsin | 3,031 | 1,481 | $32,240 | $40,000 | $54,080 | $81,120 | $118,000 | 56.5% | Madison |
| Hawaii | 3,023 | 1,131 | $35,360 | $41,600 | $60,000 | $99,000 | $140,000 | 50.5% | Honolulu |
| Kentucky | 2,949 | 1,605 | $31,200 | $37,440 | $52,000 | $85,000 | $125,000 | 54.1% | Louisville |
| Alabama | 2,589 | 1,267 | $27,040 | $33,280 | $49,201 | $76,960 | $115,000 | 53.3% | Birmingham |
| New Mexico | 2,548 | 1,243 | $31,200 | $37,440 | $58,240 | $90,480 | $130,000 | 54.5% | Albuquerque |
| Oklahoma | 2,461 | 1,126 | $27,560 | $33,280 | $45,760 | $75,000 | $110,240 | 61.0% | Tulsa |
| Louisiana | 2,048 | 1,067 | $24,960 | $31,715 | $45,760 | $72,800 | $108,701 | 61.4% | Baton Rouge |
| Idaho | 2,029 | 1,009 | $32,592 | $37,440 | $52,000 | $85,000 | $120,000 | 61.1% | Meridian |
| South Carolina | 1,907 | 1,096 | $29,120 | $35,000 | $48,610 | $75,000 | $110,000 | 59.4% | Charleston |
| Nebraska | 1,441 | 745 | $31,200 | $36,400 | $52,000 | $80,000 | $114,000 | 57.2% | Omaha |
| South Dakota | 1,099 | 591 | $33,530 | $41,314 | $55,380 | $85,000 | $125,000 | 54.8% | Sioux Falls |
| Alaska | 829 | 406 | $35,360 | $41,600 | $54,766 | $81,286 | $115,010 | 65.6% | Anchorage |
| Rhode Island | 780 | 423 | $33,374 | $41,080 | $56,160 | $83,200 | $120,000 | 60.6% | Providence |
| New Hampshire | 670 | 376 | $33,280 | $41,600 | $57,260 | $86,420 | $129,471 | 55.5% | Manchester |
| Arkansas | 666 | 421 | $24,960 | $33,280 | $45,880 | $74,880 | $113,100 | 56.0% | Little Rock |
| North Dakota | 469 | 238 | $32,864 | $38,480 | $52,000 | $80,000 | $116,438 | 64.4% | Fargo |
| Montana | 377 | 237 | $31,200 | $37,440 | $50,000 | $79,000 | $109,714 | 69.8% | Billings |
| Mississippi | 353 | 261 | $24,960 | $31,200 | $47,840 | $80,000 | $121,280 | 59.8% | Jackson |
| Maine | 76 | 67 | $33,280 | $37,440 | $47,793 | $63,980 | $102,805 | 71.1% | Portland |
| Vermont | 58 | 44 | $37,440 | $41,600 | $50,449 | $76,812 | $100,000 | 69.0% | Burlington |
| Delaware | 56 | 51 | $31,200 | $33,950 | $52,000 | $74,493 | $140,000 | 67.9% | Wilmington |
| West Virginia | 56 | 54 | $28,288 | $32,880 | $41,600 | $56,680 | $92,000 | 64.3% | Charleston |
| Wyoming | 29 | 24 | $30,960 | $35,360 | $49,920 | $62,400 | $82,482 | 69.0% | Casper |
US salaries by metro area
Metros are grouped from their principal cities only; postings in other suburbs are not counted here. Tech = software, data and cloud roles.
| Metro area | Postings | Employers | 10th pct | 25th pct | Median | 75th pct | 90th pct | Tech share | Most common role |
|---|---|---|---|---|---|---|---|---|---|
| Los Angeles–Long Beach–Anaheim | 14,470 | 5,872 | $39,520 | $48,880 | $73,600 | $115,000 | $155,000 | 3.1% | Healthcare |
| Phoenix–Mesa–Chandler | 12,934 | 4,860 | $33,280 | $40,560 | $58,240 | $94,112 | $135,200 | 3.2% | Healthcare |
| New York–Newark–Jersey City | 10,932 | 4,765 | $39,520 | $52,000 | $80,000 | $120,640 | $162,500 | 5.1% | Healthcare |
| Denver–Aurora–Lakewood | 8,972 | 3,900 | $40,000 | $47,840 | $69,680 | $101,270 | $140,360 | 3.6% | Healthcare |
| Dallas–Fort Worth–Arlington | 8,651 | 3,653 | $31,200 | $40,000 | $61,360 | $100,000 | $140,000 | 5.7% | Healthcare |
| San Francisco–Oakland–Berkeley | 6,662 | 2,955 | $43,680 | $60,026 | $98,500 | $150,000 | $189,400 | 5.3% | Healthcare |
| Chicago–Naperville–Elgin | 6,244 | 2,824 | $37,440 | $47,840 | $74,288 | $105,000 | $142,500 | 3.4% | Finance & accounting |
| Boston–Cambridge–Newton | 5,972 | 2,383 | $39,520 | $52,000 | $80,000 | $121,062 | $164,000 | 4.7% | Healthcare |
| San Jose–Sunnyvale–Santa Clara | 5,938 | 2,437 | $41,600 | $56,371 | $96,550 | $145,600 | $184,000 | 6.7% | Manufacturing & maintenance |
| Washington–Arlington–Alexandria | 5,020 | 2,524 | $39,520 | $55,000 | $83,200 | $120,001 | $160,000 | 5.9% | Healthcare |
| Seattle–Tacoma–Bellevue | 4,690 | 1,981 | $41,600 | $50,000 | $79,215 | $116,480 | $159,230 | 4.6% | Healthcare |
| Charlotte–Concord–Gastonia | 4,468 | 2,201 | $32,240 | $41,600 | $64,500 | $104,000 | $142,500 | 4.3% | Healthcare |
| San Diego–Chula Vista–Carlsbad | 3,948 | 1,714 | $37,440 | $44,056 | $70,000 | $105,000 | $150,000 | 3.3% | Healthcare |
| Raleigh–Cary | 3,926 | 1,881 | $31,200 | $41,380 | $65,520 | $102,500 | $145,600 | 4.9% | Healthcare |
| Houston–The Woodlands–Sugar Land | 3,794 | 2,058 | $29,120 | $37,440 | $57,649 | $90,000 | $129,175 | 1.9% | Healthcare |
| Virginia Beach–Norfolk–Newport News | 3,563 | 1,607 | $30,000 | $36,660 | $53,300 | $86,410 | $125,000 | 2.6% | Healthcare |
| Miami–Fort Lauderdale–West Palm Beach | 3,404 | 1,839 | $31,200 | $37,440 | $54,886 | $87,553 | $130,000 | 1.5% | Healthcare |
| Las Vegas–Henderson–Paradise | 3,226 | 1,767 | $31,200 | $37,440 | $52,000 | $85,000 | $127,810 | 1.9% | Healthcare |
| Kansas City | 3,179 | 1,577 | $33,280 | $40,000 | $58,240 | $90,000 | $129,962 | 2.7% | Healthcare |
| Riverside–San Bernardino–Ontario | 3,093 | 1,482 | $35,360 | $41,600 | $56,160 | $90,000 | $132,600 | 1.0% | Healthcare |
| Minneapolis–St. Paul–Bloomington | 2,738 | 1,378 | $35,953 | $45,000 | $63,471 | $93,600 | $133,030 | 1.8% | Healthcare |
| Indianapolis–Carmel | 2,643 | 1,363 | $31,200 | $38,779 | $56,160 | $98,088 | $135,200 | 3.1% | Healthcare |
| Rochester (NY) | 2,558 | 1,048 | $35,360 | $41,382 | $59,280 | $90,000 | $125,000 | 2.2% | Healthcare |
| Portland–Vancouver–Hillsboro | 2,552 | 1,245 | $36,920 | $42,074 | $59,109 | $93,600 | $127,992 | 2.0% | Healthcare |
| Honolulu | 2,358 | 902 | $35,360 | $41,600 | $60,000 | $96,900 | $140,000 | 2.8% | Healthcare |
| Austin–Round Rock–Georgetown | 2,324 | 1,336 | $31,200 | $39,520 | $57,718 | $93,600 | $144,700 | 4.0% | Healthcare |
| Atlanta–Sandy Springs–Alpharetta | 2,237 | 1,372 | $31,200 | $44,990 | $70,250 | $107,700 | $144,410 | 6.1% | Healthcare |
| Philadelphia–Camden–Wilmington | 2,204 | 1,027 | $35,144 | $43,680 | $65,000 | $99,200 | $136,240 | 2.7% | Healthcare |
| Tampa–St. Petersburg–Clearwater | 2,182 | 1,247 | $31,200 | $37,440 | $54,080 | $85,000 | $125,100 | 1.8% | Healthcare |
| Spokane | 2,114 | 1,054 | $36,739 | $42,562 | $58,219 | $90,000 | $125,000 | 1.8% | Healthcare |
| Memphis | 2,090 | 1,137 | $31,200 | $39,000 | $60,000 | $93,600 | $130,000 | 2.1% | Healthcare |
| Louisville | 2,090 | 1,193 | $31,200 | $39,520 | $56,160 | $90,000 | $127,966 | 1.9% | Healthcare |
| Sacramento–Roseville | 1,789 | 1,009 | $36,920 | $43,992 | $65,000 | $100,200 | $140,000 | 1.2% | Healthcare |
| Detroit–Warren–Dearborn | 1,723 | 960 | $33,280 | $41,600 | $62,400 | $96,810 | $137,209 | 3.8% | Healthcare |
| St. Louis | 1,526 | 821 | $33,280 | $39,520 | $53,310 | $83,200 | $119,300 | 2.1% | Healthcare |
| Salt Lake City | 1,488 | 929 | $33,280 | $40,545 | $62,400 | $100,000 | $140,000 | 3.1% | Healthcare |
| Baltimore–Columbia–Towson | 1,450 | 794 | $33,679 | $41,600 | $62,900 | $93,600 | $135,280 | 1.8% | Healthcare |
| Nashville–Davidson–Franklin | 1,430 | 857 | $32,760 | $39,520 | $52,000 | $83,200 | $125,000 | 2.0% | Healthcare |
| Orlando–Kissimmee–Sanford | 1,411 | 878 | $31,200 | $37,440 | $55,000 | $83,450 | $124,800 | 1.7% | Healthcare |
| San Antonio–New Braunfels | 1,380 | 835 | $29,120 | $35,360 | $50,000 | $79,040 | $120,000 | 3.2% | Healthcare |
| Hartford | 1,360 | 602 | $41,600 | $58,326 | $92,500 | $126,984 | $167,590 | 8.5% | Healthcare |
| Columbus | 1,307 | 801 | $31,200 | $37,440 | $52,000 | $83,200 | $124,800 | 2.7% | Healthcare |
| Cleveland–Elyria | 1,302 | 761 | $31,200 | $40,000 | $55,560 | $85,000 | $124,800 | 1.3% | Healthcare |
| Albuquerque | 1,194 | 652 | $31,200 | $37,440 | $52,000 | $83,140 | $130,000 | 2.8% | Healthcare |
| Pittsburgh | 1,063 | 630 | $31,200 | $37,440 | $50,000 | $75,000 | $113,166 | 2.2% | Healthcare |
| Jacksonville | 1,057 | 711 | $31,200 | $35,360 | $49,000 | $75,000 | $114,400 | 0.8% | Healthcare |
| Cincinnati | 990 | 635 | $31,200 | $37,440 | $52,000 | $85,000 | $120,000 | 1.7% | Healthcare |
| Milwaukee–Waukesha | 865 | 494 | $33,280 | $42,000 | $60,000 | $88,060 | $125,000 | 0.8% | Healthcare |
| Omaha | 814 | 472 | $32,481 | $38,480 | $56,103 | $84,968 | $124,407 | 2.8% | Operations |
| Oklahoma City | 788 | 467 | $27,040 | $35,000 | $49,920 | $80,000 | $119,720 | 1.6% | Healthcare |
| Boise | 549 | 340 | $33,280 | $38,022 | $55,000 | $89,440 | $127,200 | 0.4% | Healthcare |
Top 50 US cities by postings with pay
| # | City | Postings | Employers | 25th pct | Median | 75th pct | Hourly share | Most common role |
|---|---|---|---|---|---|---|---|---|
| 1 | Los Angeles, CA | 7,605 | 3,596 | $50,003 | $77,000 | $118,560 | 43.7% | Healthcare |
| 2 | New York, NY | 7,051 | 3,299 | $60,000 | $85,000 | $127,500 | 30.1% | Healthcare |
| 3 | Denver, CO | 6,888 | 3,178 | $50,000 | $71,261 | $105,000 | 40.3% | Healthcare |
| 4 | Phoenix, AZ | 6,675 | 2,960 | $42,089 | $64,480 | $100,000 | 50.3% | Healthcare |
| 5 | Chicago, IL | 5,022 | 2,305 | $50,000 | $75,960 | $110,000 | 30.5% | Finance & accounting |
| 6 | Boston, MA | 4,670 | 1,925 | $52,000 | $80,000 | $120,000 | 36.4% | Healthcare |
| 7 | Charlotte, NC | 4,192 | 2,110 | $41,600 | $65,000 | $104,274 | 49.9% | Healthcare |
| 8 | San Francisco, CA | 3,940 | 1,992 | $65,515 | $102,500 | $150,000 | 34.0% | Finance & accounting |
| 9 | Houston, TX | 3,438 | 1,897 | $37,440 | $60,000 | $93,000 | 50.5% | Healthcare |
| 10 | Washington, DC | 3,290 | 1,774 | $58,455 | $85,000 | $123,375 | 31.2% | Operations |
| 11 | Raleigh, NC | 3,258 | 1,643 | $41,600 | $70,000 | $104,000 | 43.6% | Healthcare |
| 12 | San Diego, CA | 3,070 | 1,410 | $45,760 | $70,720 | $108,701 | 48.2% | Healthcare |
| 13 | San Jose, CA | 2,688 | 1,320 | $52,000 | $86,200 | $132,000 | 43.0% | Manufacturing & maintenance |
| 14 | Rochester, NY | 2,558 | 1,048 | $41,382 | $59,280 | $90,000 | 52.2% | Healthcare |
| 15 | Las Vegas, NV | 2,392 | 1,415 | $37,440 | $53,654 | $90,019 | 54.9% | Healthcare |
| 16 | Seattle, WA | 2,376 | 1,195 | $54,080 | $82,546 | $124,800 | 41.5% | Healthcare |
| 17 | Honolulu, HI | 2,358 | 902 | $41,600 | $60,000 | $96,900 | 49.7% | Healthcare |
| 18 | Dallas, TX | 2,305 | 1,446 | $41,600 | $65,000 | $104,000 | 47.7% | Sales |
| 19 | Virginia Beach, VA | 2,208 | 1,070 | $37,440 | $56,603 | $93,525 | 53.3% | Healthcare |
| 20 | Spokane, WA | 2,114 | 1,054 | $42,562 | $58,219 | $90,000 | 58.6% | Healthcare |
| 21 | Louisville, KY | 2,090 | 1,193 | $39,520 | $56,160 | $90,000 | 49.7% | Healthcare |
| 22 | Memphis, TN | 2,090 | 1,137 | $39,000 | $60,000 | $93,600 | 49.2% | Healthcare |
| 23 | Atlanta, GA | 2,016 | 1,246 | $45,008 | $72,172 | $108,040 | 40.5% | Healthcare |
| 24 | Plano, TX | 2,004 | 974 | $41,600 | $70,000 | $109,200 | 49.3% | Healthcare |
| 25 | Austin, TX | 1,957 | 1,155 | $41,600 | $61,300 | $100,000 | 46.6% | Sales |
| 26 | Indianapolis, IN | 1,953 | 1,088 | $40,000 | $58,240 | $98,800 | 52.4% | Healthcare |
| 27 | Philadelphia, PA | 1,925 | 954 | $43,992 | $65,000 | $99,000 | 41.8% | Healthcare |
| 28 | Kansas City, MO | 1,859 | 990 | $39,520 | $55,300 | $83,200 | 51.4% | Healthcare |
| 29 | Minneapolis, MN | 1,832 | 1,010 | $47,840 | $67,500 | $100,000 | 37.8% | Operations |
| 30 | Irvine, CA | 1,791 | 853 | $53,234 | $80,000 | $120,000 | 40.2% | Finance & accounting |
| 31 | Scottsdale, AZ | 1,738 | 855 | $39,520 | $56,254 | $94,000 | 51.7% | Healthcare |
| 32 | Colorado Springs, CO | 1,519 | 777 | $39,520 | $55,000 | $87,500 | 49.4% | Healthcare |
| 33 | St. Louis, MO | 1,519 | 817 | $39,520 | $54,000 | $83,200 | 54.6% | Healthcare |
| 34 | Tempe, AZ | 1,492 | 652 | $41,600 | $55,000 | $90,820 | 54.0% | Finance & accounting |
| 35 | Salt Lake City, UT | 1,488 | 929 | $40,545 | $62,400 | $100,000 | 49.2% | Healthcare |
| 36 | Portland, OR | 1,475 | 803 | $43,680 | $60,000 | $94,740 | 55.5% | Healthcare |
| 37 | Syracuse, NY | 1,460 | 688 | $41,600 | $62,133 | $90,320 | 57.4% | Healthcare |
| 38 | Riverside, CA | 1,427 | 718 | $41,600 | $61,000 | $92,650 | 57.7% | Healthcare |
| 39 | Sacramento, CA | 1,422 | 838 | $45,760 | $70,000 | $105,000 | 54.0% | Healthcare |
| 40 | Orlando, FL | 1,387 | 859 | $37,440 | $55,000 | $85,000 | 55.7% | Healthcare |
| 41 | San Antonio, TX | 1,375 | 833 | $35,360 | $50,000 | $79,040 | 56.8% | Healthcare |
| 42 | Hartford, CT | 1,360 | 602 | $58,326 | $92,500 | $126,984 | 25.8% | Healthcare |
| 43 | Miami, FL | 1,353 | 805 | $37,440 | $54,080 | $90,000 | 50.8% | Healthcare |
| 44 | Tampa, FL | 1,353 | 852 | $40,000 | $59,654 | $90,000 | 49.3% | Healthcare |
| 45 | Baltimore, MD | 1,316 | 720 | $41,600 | $63,349 | $94,000 | 50.9% | Healthcare |
| 46 | Columbus, OH | 1,303 | 798 | $37,440 | $52,000 | $83,542 | 55.7% | Healthcare |
| 47 | Cleveland, OH | 1,302 | 761 | $40,000 | $55,560 | $85,000 | 47.2% | Healthcare |
| 48 | Buffalo, NY | 1,283 | 617 | $42,345 | $60,000 | $89,520 | 44.9% | Healthcare |
| 49 | Stockton, CA | 1,274 | 712 | $42,338 | $60,000 | $98,000 | 62.9% | Healthcare |
| 50 | Tallahassee, FL | 1,272 | 665 | $39,395 | $58,775 | $100,000 | 47.2% | Healthcare |
Top 50 highest-paying job titles in the US
Titles lower-cased with location suffixes removed; titles with 50+ postings from 10+ employers, ranked by median.
| # | Job title | Postings | Employers | 25th pct | Median | 75th pct | Role family | Top state |
|---|---|---|---|---|---|---|---|---|
| 1 | Primary Care Physician | 68 | 35 | $168,052 | $200,000 | $239,124 | Healthcare | California |
| 2 | Vice President | 58 | 51 | $150,000 | $180,000 | $195,000 | Finance & accounting | California |
| 3 | Dentist | 68 | 48 | $80,600 | $175,000 | $205,000 | Healthcare | California |
| 4 | Chief Financial Officer | 150 | 133 | $143,331 | $172,500 | $201,701 | Finance & accounting | California |
| 5 | Medical Science Liaison | 50 | 38 | $144,300 | $172,500 | $185,075 | Healthcare | Massachusetts |
| 6 | Medical Director | 92 | 70 | $100,000 | $170,000 | $220,000 | Healthcare | California |
| 7 | Project Executive | 52 | 38 | $146,155 | $167,550 | $200,000 | Operations | California |
| 8 | Director Of Engineering | 63 | 58 | $130,000 | $164,444 | $200,000 | Manufacturing & maintenance | California |
| 9 | Lead Software Engineer | 65 | 54 | $127,500 | $152,000 | $174,750 | Software engineering | California |
| 10 | Engineering Manager | 137 | 127 | $121,650 | $150,000 | $200,000 | Manufacturing & maintenance | California |
| 11 | Director Business Development | 51 | 48 | $117,500 | $150,000 | $162,750 | Sales | California |
| 12 | Chief Operating Officer | 54 | 51 | $91,250 | $150,000 | $180,295 | Operations | California |
| 13 | Chief Of Staff | 84 | 79 | $125,000 | $150,000 | $178,601 | Operations | California |
| 14 | Psychiatric Mental Health Nurse Practitioner | 52 | 30 | $113,750 | $149,880 | $190,710 | Healthcare | Texas |
| 15 | Senior Tax Manager | 51 | 39 | $139,500 | $148,000 | $172,500 | Finance & accounting | Illinois |
| 16 | Machine Learning Engineer | 54 | 45 | $117,500 | $145,300 | $165,975 | Data & analytics | California |
| 17 | Director | 211 | 174 | $110,000 | $145,000 | $174,525 | Operations | California |
| 18 | Senior Software Engineer | 272 | 202 | $118,675 | $140,500 | $165,700 | Software engineering | California |
| 19 | Technical Program Manager | 57 | 51 | $105,000 | $140,000 | $163,400 | Product & project management | California |
| 20 | Senior Product Manager | 132 | 120 | $124,750 | $140,000 | $170,000 | Product & project management | California |
| 21 | Senior Program Manager | 51 | 49 | $115,421 | $140,000 | $150,000 | Operations | California |
| 22 | Director Of Business Development | 63 | 60 | $100,000 | $140,000 | $173,750 | Sales | California |
| 23 | Solutions Architect | 50 | 45 | $118,203 | $139,898 | $153,750 | Design | California |
| 24 | Senior Data Scientist | 60 | 54 | $123,412 | $139,109 | $157,000 | Data & analytics | California |
| 25 | Senior Data Engineer | 55 | 52 | $120,000 | $139,105 | $150,000 | Data & analytics | California |
| 26 | Business Development Director | 55 | 50 | $107,000 | $137,500 | $172,450 | Sales | California |
| 27 | Travel Nuclear Medicine Technologist | 67 | 41 | $121,498 | $135,200 | $141,960 | Healthcare | California |
| 28 | Family Nurse Practitioner | 69 | 57 | $111,842 | $135,000 | $145,600 | Healthcare | New York |
| 29 | Psychiatric Nurse Practitioner | 95 | 48 | $117,820 | $135,000 | $158,500 | Healthcare | Colorado |
| 30 | Senior Project Manager | 381 | 275 | $115,000 | $134,100 | $160,000 | Product & project management | California |
| 31 | Senior Manager | 87 | 74 | $116,525 | $132,400 | $151,320 | Operations | California |
| 32 | Clinical Pharmacist | 59 | 51 | $118,830 | $131,394 | $145,600 | Healthcare | California |
| 33 | Plant Manager | 65 | 57 | $110,000 | $130,000 | $150,000 | Manufacturing & maintenance | California |
| 34 | Director Of Finance | 77 | 70 | $110,000 | $130,000 | $155,000 | Finance & accounting | California |
| 35 | Senior Electrical Engineer | 97 | 77 | $110,000 | $128,600 | $157,500 | Manufacturing & maintenance | California |
| 36 | Veterinarian | 94 | 63 | $110,500 | $126,250 | $150,000 | Healthcare | California |
| 37 | Embedded Software Engineer | 53 | 40 | $101,000 | $126,000 | $160,000 | Software engineering | California |
| 38 | Physician Assistant | 273 | 183 | $108,000 | $126,000 | $149,760 | Healthcare | California |
| 39 | Family Medicine Physician | 129 | 63 | $37,440 | $125,000 | $230,000 | Healthcare | California |
| 40 | Sales Director | 88 | 80 | $89,340 | $125,000 | $170,000 | Sales | California |
| 41 | Controller | 266 | 230 | $100,000 | $125,000 | $150,000 | Finance & accounting | California |
| 42 | Pharmacist | 151 | 89 | $114,400 | $125,000 | $144,000 | Healthcare | California |
| 43 | Nurse Practitioner | 598 | 355 | $107,275 | $125,000 | $145,000 | Healthcare | California |
| 44 | Attorney | 121 | 61 | $100,000 | $125,000 | $160,000 | Legal | California |
| 45 | Senior Scheduler | 63 | 43 | $117,550 | $125,000 | $145,000 | Construction & trades | California |
| 46 | Associate Director | 73 | 54 | $85,000 | $123,750 | $151,500 | Operations | Indiana |
| 47 | Psychologist | 70 | 50 | $104,250 | $123,548 | $156,000 | Healthcare | Florida |
| 48 | Clinical Psychologist | 81 | 41 | $111,000 | $123,028 | $152,000 | Healthcare | California |
| 49 | Associate Veterinarian | 90 | 70 | $105,000 | $120,000 | $150,000 | Healthcare | California |
| 50 | Senior Estimator | 156 | 116 | $110,000 | $120,000 | $155,000 | Construction & trades | California |
US salaries by industry / occupation group
Occupation codes mapped to their major group; free-text categories normalised into the same groups.
| Group | Postings | Employers | 10th pct | 25th pct | Median | 75th pct | 90th pct | Hourly share |
|---|---|---|---|---|---|---|---|---|
| Software & IT | 8,472 | 3,525 | $62,194 | $88,132 | $117,500 | $150,000 | $180,000 | 24.6% |
| Legal & Compliance | 1,970 | 1,106 | $51,980 | $70,000 | $100,000 | $145,450 | $180,000 | 18.7% |
| Operations & Consulting | 24,003 | 9,761 | $45,000 | $66,500 | $100,000 | $138,220 | $175,000 | 17.4% |
| Banking, Finance & Accounts | 16,471 | 7,142 | $45,500 | $60,000 | $82,000 | $112,000 | $150,000 | 22.7% |
| Military | 107 | 48 | $28,080 | $44,845 | $80,600 | $111,000 | $140,000 | 28.0% |
| Science & Research | 1,287 | 671 | $40,115 | $52,146 | $77,522 | $111,974 | $150,000 | 37.8% |
| Engineering & Manufacturing | 14,810 | 6,234 | $37,440 | $48,000 | $75,000 | $110,000 | $146,000 | 50.1% |
| Human Resources | 977 | 751 | $39,520 | $49,920 | $69,846 | $100,000 | $133,153 | 38.6% |
| Marketing, Media & Communications | 3,671 | 2,198 | $36,400 | $45,760 | $67,500 | $105,000 | $148,450 | 44.7% |
| Healthcare & Pharma | 28,742 | 8,873 | $33,280 | $41,600 | $66,123 | $103,792 | $135,200 | 70.9% |
| Construction & Real Estate | 3,294 | 1,872 | $37,440 | $45,760 | $62,400 | $92,500 | $125,350 | 60.4% |
| Education & Training | 8,151 | 3,008 | $32,000 | $39,520 | $56,116 | $100,000 | $166,400 | 72.4% |
| Community & Social Service | 2,882 | 1,553 | $35,360 | $41,600 | $54,080 | $75,000 | $104,759 | 60.7% |
| Sales & Business Development | 15,572 | 7,271 | $31,200 | $37,170 | $52,000 | $83,000 | $130,000 | 41.1% |
| Logistics & Supply Chain | 12,056 | 4,862 | $32,760 | $37,440 | $46,985 | $67,600 | $95,000 | 70.6% |
| Security & Protective Services | 846 | 520 | $33,280 | $37,440 | $45,760 | $60,262 | $95,000 | 76.1% |
| Facilities & Maintenance | 5,536 | 2,993 | $31,200 | $37,440 | $45,760 | $62,400 | $78,000 | 82.5% |
| Admin & Office Support | 9,028 | 5,871 | $31,616 | $37,440 | $44,720 | $57,500 | $80,484 | 65.7% |
| Customer Service & BPO | 3,698 | 2,132 | $31,200 | $36,920 | $44,720 | $61,490 | $103,500 | 65.8% |
| Agriculture | 102 | 69 | $33,280 | $36,400 | $41,600 | $47,840 | $62,160 | 84.3% |
| Retail & E-commerce | 2,598 | 1,200 | $30,160 | $34,024 | $39,520 | $49,920 | $69,495 | 82.8% |
| Personal Care & Services | 2,985 | 1,490 | $27,040 | $32,240 | $39,520 | $52,000 | $72,800 | 89.4% |
| Hospitality & Food | 6,426 | 2,790 | $24,960 | $31,200 | $35,360 | $41,600 | $54,800 | 91.8% |
US salaries by years of experience asked
Only postings that state a minimum experience. The 16+ band is small (a few hundred postings) and mixes senior and mis-parsed figures.
| Experience asked | Postings | Employers | 10th pct | 25th pct | Median | 75th pct | 90th pct | Most common role |
|---|---|---|---|---|---|---|---|---|
| 0-1 yrs | 41,995 | 17,380 | $30,730 | $35,162 | $41,600 | $57,000 | $83,200 | Retail & hospitality |
| 2-3 yrs | 14,343 | 7,277 | $38,480 | $49,920 | $65,000 | $86,800 | $120,000 | Healthcare |
| 4-6 yrs | 8,925 | 4,543 | $57,200 | $75,000 | $95,000 | $121,023 | $150,000 | Operations |
| 7-10 yrs | 5,380 | 2,643 | $83,200 | $104,003 | $130,000 | $160,000 | $190,000 | Operations |
| 11-15 yrs | 1,077 | 665 | $62,400 | $120,000 | $152,000 | $190,000 | $222,640 | Operations |
| 16+ yrs | 255 | 207 | $52,000 | $62,400 | $76,960 | $130,000 | $177,260 | Operations |
US postings with pay by month
Collection grows sharply in 2026; monthly counts reflect collection as well as hiring.
| Month | Postings | Employers | States | 25th pct | Median | 75th pct | Hourly share |
|---|---|---|---|---|---|---|---|
| 2024-01 | 297 | 158 | 34 | $41,600 | $63,480 | $107,000 | 50.5% |
| 2024-02 | 278 | 140 | 34 | $43,680 | $62,450 | $107,708 | 68.3% |
| 2024-03 | 1,647 | 625 | 47 | $39,832 | $64,480 | $115,000 | 56.2% |
| 2024-04 | 3,332 | 1,394 | 47 | $40,989 | $62,450 | $105,445 | 59.7% |
| 2024-05 | 3,793 | 1,692 | 45 | $41,600 | $65,832 | $107,578 | 52.1% |
| 2024-06 | 5,793 | 2,086 | 46 | $46,571 | $71,450 | $111,500 | 49.6% |
| 2024-07 | 3,621 | 1,623 | 46 | $45,427 | $70,720 | $111,748 | 51.1% |
| 2024-08 | 2,989 | 1,342 | 45 | $45,240 | $68,640 | $108,445 | 51.7% |
| 2024-09 | 3,373 | 1,995 | 42 | $41,600 | $62,000 | $99,000 | 55.2% |
| 2024-10 | 3,141 | 2,043 | 42 | $41,600 | $60,320 | $98,800 | 55.0% |
| 2024-11 | 12,097 | 6,421 | 44 | $46,000 | $75,000 | $114,400 | 44.9% |
| 2024-12 | 13,561 | 7,292 | 50 | $45,760 | $72,800 | $112,060 | 46.7% |
| 2025-01 | 15,622 | 7,824 | 51 | $43,140 | $67,600 | $108,524 | 50.6% |
| 2025-02 | 4,554 | 2,996 | 50 | $39,520 | $52,500 | $85,028 | 61.9% |
| 2025-03 | 7,912 | 4,724 | 49 | $41,600 | $53,388 | $90,530 | 61.4% |
| 2025-04 | 13,107 | 7,184 | 49 | $45,760 | $80,000 | $114,582 | 43.6% |
| 2025-05 | 10,269 | 4,979 | 51 | $35,360 | $45,760 | $72,000 | 68.1% |
| 2025-06 | 4,064 | 2,090 | 48 | $37,440 | $52,000 | $85,335 | 65.6% |
| 2025-07 | 2,862 | 1,707 | 46 | $37,440 | $49,920 | $80,142 | 65.7% |
| 2025-08 | 2,541 | 1,518 | 48 | $37,450 | $52,000 | $80,000 | 68.4% |
| 2025-09 | 2,581 | 1,562 | 48 | $39,520 | $52,000 | $85,000 | 60.7% |
| 2025-10 | 2,692 | 1,638 | 46 | $39,390 | $55,000 | $90,000 | 62.3% |
| 2025-11 | 2,602 | 1,639 | 48 | $39,520 | $55,000 | $93,600 | 57.3% |
| 2025-12 | 5,021 | 2,227 | 50 | $41,600 | $70,000 | $157,600 | 68.4% |
| 2026-01 | 6,904 | 4,042 | 50 | $37,440 | $52,000 | $83,200 | 62.0% |
| 2026-02 | 11,080 | 6,092 | 50 | $37,440 | $50,000 | $80,000 | 63.8% |
| 2026-03 | 17,946 | 9,122 | 51 | $37,440 | $52,000 | $80,000 | 62.4% |
| 2026-04 | 49,633 | 19,845 | 51 | $39,728 | $54,122 | $83,200 | 57.9% |
| 2026-05 | 63,584 | 23,617 | 51 | $39,520 | $55,000 | $85,000 | 56.1% |
| 2026-06 | 73,432 | 23,956 | 51 | $45,760 | $71,000 | $110,000 | 41.2% |
Column dictionary
18 columns in the sample CSV.
| Column | Description |
|---|---|
posting_id | stable 12-character ID of the source listing (a hash, not the source ID); a listing the employer re-posted with a new title or month keeps its ID, so about 1.6% of rows share an ID with another row |
posted_month | month the posting was published (YYYY-MM) |
company | hiring company name as posted |
company_domain | company website domain when the name matches exactly one US company in Fliar's index, else blank |
job_title | job title as posted (phone/e-mail-like strings removed) |
role_family | role family (from the posting, else inferred from the title, else from the category) |
seniority | intern / entry / mid / senior / lead / manager / director / executive; blank when neither title nor experience gives a signal |
experience_band | minimum experience asked, banded; blank when not stated |
city | city |
state | two-letter state code |
metro | metro area when the city is one of its principal cities, else blank |
industry_category | industry / occupation group (occupation codes mapped to their major group, free text normalised) |
remote | onsite / remote / hybrid when stated |
pay_period | pay period as posted: hourly, weekly, monthly or annual |
salary_min_usd | lower end of the posted range, US$ per year (blank when only one figure is posted) |
salary_max_usd | upper end of the posted range, US$ per year |
salary_mid_usd | midpoint of the range (or the single figure), US$ per year |
fliar_profile_url | full company profile on Fliar (financials, funding, team, news) |
Method
- Scope. Postings located in the United States with a title, an employer and stated pay, published 2024-01-01 to 2026-06-30.
- Deduplication. Postings with the same employer, normalised title and month are one posting; the copy with the most structured fields is kept.
- Annualisation. Hourly × 2,080, daily × 260, weekly × 52, bi-weekly × 26, semi-monthly × 24, monthly × 12. Postings without a currency are taken as US$. A lower bound below a tenth of the upper bound is treated as missing, and the midpoint is then the single figure.
- Absurd values dropped. Annual pay below US$15,000 or above US$1,000,000; weekly travel-contract healthcare pay that was annualised as if it were a yearly figure; hourly rates above US$150 or weekly above US$5,000 outside professional roles (per-load or per-mile figures); more than US$200,000 for low-wage titles such as cook, cashier or driver; and a non-US currency (411 postings in all: weekly travel-contract pay mislabelled 297, implausible for role 59, currency differs from country 37, implausible hourly rate 10, below floor 7, implausible weekly rate 1).
- Labels.
role_familyfrom the posting, else keyword rules on the title, else the category.seniorityfrom the posting or title, else from years asked (≤1 entry, 2–5 mid, 6–10 senior, 11+ lead).metrogroups principal cities of each metro area.remotefrom the posting's work-mode field and "remote" / "hybrid" in the title. - Privacy and provenance. URLs, source names, descriptions and recruiter details are not published; posting IDs are hashes. Postings whose employer or title names a job board or data provider are dropped.
-
Company link.
company_domainis filled only when the lower-cased employer name matches exactly one US company in Fliar's index. -
Sample. Each company key is ranked by
sha1(key). Keys are taken in rank order until the file holds max(25%, 5,000) rows (capped at 100,000). -
Profile links. Links are built from Fliar's company index and checked against it. A row whose company has no public profile has an empty link.
Limitations
- Pay-transparency laws make postings from some states (California, Colorado, Washington, New York) far more likely to state pay, so those states are over-represented.
- Posted pay is an offer range, not realised pay; it usually excludes bonus, equity and benefits.
- Collection grows sharply in 2026 (April–June 2026 hold most rows), so month-to-month changes mix collection with hiring.
- Hourly pay is annualised at 2,080 hours; part-time and per-diem roles are therefore overstated as annual income.
- Staffing agencies post on behalf of clients and appear as the employer.
- Role families and seniority are keyword-based and can be wrong for unusual titles; seniority is blank for many postings.
Cite this dataset
Fliar BI. (2026). US Salary Data 2026: 350k Job Postings (Sample release) [Data set]. Fliar BI. https://fliarbi.com/datasets/us-salary-benchmarks-2026/
@misc{fliarbi_us_salary_benchmarks_2026_2026,
  author    = {{Fliar BI}},
  title     = {{US Salary Data 2026: 350k Job Postings}},
  year      = {2026},
  publisher = {Fliar BI},
  url       = {https://fliarbi.com/datasets/us-salary-benchmarks-2026/},
  note      = {Sample release. Licence CC BY-NC 4.0}
}