Locked revenue figures are available in Radar; the eight company financial previews stay the same throughout this page. A dash means the figure is outside these featured lists. Revenue years vary by company; the figures are not a like-for-like revenue comparison. Compare annual accounts ↗
Australia’s
media & entertainment industry,
in focus.
The companies, capital and talent shaping media & entertainment in Australia. Find the leaders. Understand the segments. See where the activity is.

An industry ecosystem,
measured in context.
MEET THE COMPANIESExplore Australia’s media & entertainment leaders
24 featured companies from the funding, hiring, revenue and team-size leaderboards.
Expand panel +
Explore Australia’s media & entertainment leaders
24 featured companies from the funding, hiring, revenue and team-size leaderboards.
Company discovery
Recorded evidence onlyExplore the live startup set in Radar
No company example met every recorded classification, independence and public-profile gate in this snapshot. The live directory may have newer qualifying companies.
Explore classified startups in Radar ↗Media & Entertainment industry KPIs in Australia
A few useful ratios bring the size of this ecosystem into perspective.
42 of 2,229 tracked companies have open roles.
89 of 2,229 tracked companies have a recorded round.
Share of disclosed capital received by the three largest recorded recipients.
Midpoint of 96 rounds with a disclosed amount.
Scale is concentrated. Opportunity is broader. The three largest funding recipients hold 77.9% of disclosed capital, while 96.0% of tracked companies have no recorded funding round.
Explore the segments →CAPITAL & COMPANY FORMATIONHow Australia media & entertainment has grown
Recorded company formation and disclosed funding across the complete annual series shown.
Expand panel +
How Australia media & entertainment has grown
Recorded company formation and disclosed funding across the complete annual series shown.
Disclosed funding by year
Sum of recorded funding rounds · USD
View the numbers
| Year | Funding (USD) | Founded | Raising |
|---|---|---|---|
| 2016 | $27.12M | 110 | 9 |
| 2017 | $37.9M | 100 | 11 |
| 2018 | $141.5M | 87 | 7 |
| 2019 | $162.66M | 116 | 7 |
| 2020 | $221.99M | 107 | 10 |
| 2021 | $349.59M | 110 | 14 |
| 2022 | $131.73M | 91 | 13 |
| 2023 | $144.82M | 90 | 6 |
| 2024 | $17.48M | 77 | 5 |
| 2025 | $27.78M | 6 | 3 |
Funding concentration
Share of all disclosed company funding.
- Foxtel52.0%
- Canva14.7%
- Wolf Minerals11.2%
- Other companies22.1%
Funding by stage
113 recorded rounds since 2016
Investors appearing most often
Recorded participation in media & entertainment company rounds since 2016.
- 01Blackbird Ventures 7 rounds
- 02Felicis Ventures 5 rounds
- 03General Catalyst 3 rounds
- 04Sequoia Capital 3 rounds
- 05Aura Group 2 rounds
- 06Techstars 2 rounds
- 07T. Rowe Price 2 rounds
- 08Smash Capital 2 rounds
- 09TIRTA 2 rounds
- 010Yolo Investments 2 rounds
Recent recorded rounds
Latest recorded rounds · USDLargest and notable recorded rounds
Each card is one recorded roundBacked by T. Rowe Price and Franklin Templeton Investments and others.
Backed by AMMA Private Equity.
Backed by Blackbird Ventures and Bessemer Venture Partners and others.
Backed by Blackbird Ventures and Dragoneer Investment Group and others.
Backed by General Catalyst and Felicis Ventures and others.
Backed by Blackbird Ventures and General Catalyst and others.
Backed by Sequoia Capital and Blackbird Ventures and others.
Participating investors were not recorded in this snapshot.
Backed by Felicis Ventures and Blackbird Ventures and others.
Participating investors were not recorded in this snapshot.
THE BUSINESS BEHIND THE ACTIVITYRevenue, profitability & financial strength
Expand panel +
Revenue, profitability & financial strength
Annual accounts availability
The measured Australia identity-to-filing probe did not produce a qualifying designated legal or national-ID join: bare ticker overlaps lack a recorded ASX exchange designation and are not designated legal or national identifiers.
Web traffic, app reach and release cadence
How the Australia companies on this page show up online: the sites people visit, the apps they install, and how often those apps ship.
Busiest websites
96 of the 2,229 companies on this page carry a measured traffic record (4.3%); these are the largest of those, by monthly visits. The median among them is 567,360 visits.
| Company | Monthly visits | Authority | Mobile |
|---|---|---|---|
| Canvacanva.com | 854,872,120 | 100 | 16.6% |
| Newsnews.com.au | 47,385,506 | 78 | 79.7% |
| envatoenvato.com | 31,730,362 | 75 | 11.8% |
| Leonardo Aileonardo.ai | 24,021,436 | 67 | 58.1% |
| emojipediaemojipedia.org | 16,207,534 | 84 | 34.3% |
| ScienceAlertsciencealert.com | 14,057,511 | 56 | 92.6% |
| Nine Digitalnine.com.au | 12,930,120 | 72 | 71.6% |
| Drivedrive.com.au | 12,684,717 | 55 | 91.1% |
| 9News9news.com.au | 10,394,354 | 73 | 67.9% |
| Footybitefootybite.to | 8,364,985 | 40 | 62.8% |
Visits and authority are third-party web estimates, not company-reported figures.
Most-installed apps
209 of these companies (9.4%) publish at least one Android app — 375 apps in all, carrying 1.1B installs between them.
| App | Installs | Rating | Store category |
|---|---|---|---|
| Canva: AI Photo & Video EditorCanva | 732.1M | 4.8 | Art & Design |
| ORG 24: Your MusicSofeh Sunrise | 223.4M | 4.4 | Music & Audio |
| Dazzil Film - Vintage CameraDazz Cam | 20M | 4.2 | Photography |
| Stan.Stan. | 16.5M | 3.6 | Entertainment |
| Ebook ReadereBooks | 11.5M | 3.9 | Books & Reference |
| Leonardo.Ai - Image GeneratorLeonardo Ai | 9.8M | 4.5 | Art & Design |
| 7plus7plus | 9.7M | 3.5 | Entertainment |
| Baby PicsBaby Pics | 6.3M | 4.6 | Photography |
| 9Now9Now | 6.1M | 3.3 | Entertainment |
| Cricket Australia LiveCricket Australia | 6M | 4.4 | Sports |
Installs are lifetime totals to date at the June 2026 store reading — a measure of reach, not of people using an app today.
App reach by segment
The busiest app inside each of this page’s own segments, with the quarterly release trend behind it (2024Q1–2026Q2).
| Segment | Apps | Installs | Leading app | Release trend |
|---|---|---|---|---|
| Online Photos | 35 | 773.9M | Canva: AI Photo & Video Editor 732.1M | |
| Tech For Digital Publishers | 5 | 732.1M | Feedverse 1.7K | |
| Music Tech | 61 | 238M | ORG 24: Your Music 223.4M | |
| Continued Learning | 17 | 228.9M | Maestro - Music Composer 4.4M | |
| Ott Video | 87 | 39.9M | Stan. 16.5M | |
| Sports Tech | 47 | 20.8M | Cricket Australia Live 6M | |
| Tv Broadcasting Services | 5 | 17.5M | 9Now 6.1M | |
| Internet First Media | 65 | 16.5M | World Football Live 3.5M |
A company can carry several segment tags, so these rows overlap and should not be added together. Trend lines are zero-based and share one quarter grid, so a flat line is a quiet segment, not a missing one.
Release cadence by quarter
New apps published, beside apps whose most recent update landed in that quarter — the second bar is how much of the shelf is still being maintained.
Darker bars are new releases, lighter bars apps updated. 320 of 375 apps carry a release date. The series ends at 2026Q1, the last quarter that closed before the June 2026 reading.
INSIDE THE INDUSTRYThe Australia media & entertainment market map
Explore the segments behind the headline numbers.
Expand panel +
The Australia media & entertainment market map
Explore the segments behind the headline numbers.
Where companies are building
Rank segments by scale, hiring or disclosed funding.
Companies can sit in several segments. Counts and funding overlap.
Consumer digital
The largest measured segment in this report snapshot.
16 companies hiring · $1.14B disclosed funding
Explore in RadarHow companies make money
Common revenue models; a company can use more than one.
THE COMPANIES IN MOTIONWho is listing, hiring leaders, launching and winning work
Recorded corporate activity linked to companies in this landscape.
Expand panel +
Who is listing, hiring leaders, launching and winning work
Recorded corporate activity linked to companies in this landscape.
Recent corporate headlines 10 dated reports
The Sharkey brothers, who pocketed millions selling online accommodation portal Stayz to Fairfax Media in 2005 and were also behind marketing automation startup Autopilot, will join Canva in leadership roles.
Canva announced on Wednesday the dual acquisition of Simtheory, an AI collaboration and agent management platform, and Ortto, a customer data and marketing automation company.
The investment is consistent with ARC’s existing activities of making selective investments in financial services and related businesses.
As with my previous proportional takeover bid in October for 2.9 percent of the group’s shares, which closed on January 30, 2026, the [new] offer will deliver an attractive premium relative to historical trading prices in shares for a portion of each shareholder’s investment in Ainsworth.
Entering Lithuania by acquiring the country’s market leader is a decisive step in our long-term growth strategy. The Baltics hold tremendous potential for FEG, and this forward-looking investment will create substantial value for our customers, partners, and teams in the years to come.
NextBet Pty Ltd has acquired PlayUp. Your PlayUp account will automatically transfer to NextBet, along with any existing cash, bonus balances, and pending bets.
Ninety-nine per cent of shares cast supported the $385 million deal, which will now go to the New South Wales Supreme Court for approval on Tuesday and come into effect on January 7, according to Seven West Media.
Havas has made a major move in the ANZ land, acquiring independent media agency Kaimera in a deal that brings additional scale, talent and specialist capability to Havas Media Network.
BetMakers Technology Group has struck a definitive asset purchase agreement to acquire Las Vegas Dissemination Company (LVDC).
Australian gambling and wagering company Tabcorp has made a successful comeback to the Australian Medium Term Note (AMTN), pricing AU300 million ($195 million) of 5.5-year notes.
Full recorded event mix
Top 10 categories among 512 recorded events in the 24-month window.
IPO pipeline
2 companies with recorded IPO activity
IPO2 reports
IPO · BSE and NSE1 reports
Leadership moves
82 tracked people moves
Appointment Independent non-executive Chairman
Resignation Previously Chairman of Southern Cross Media Group
Appointment Managing Director and Chief Executive Officer
Appointment Head of Technology
Resignation Previously Chief Technology Officer
Appointment Vice President of Marketing and Product Strategy
Appointment Director – Video and Social
Departure Early-stage investor and strategic advisor
Product launches
Products, platforms and features in the recorded window
Agentic Platform
AI-powered design and workflow automation platform
AI customer‑service assistant built with Salesforce
Contract wins
12 recorded customer wins
Customer: dollar generalRetail
Customer: high rollerDigital Marketing
Customer: United StatesDefense
Customer: pursuit minerals
Customer: Dubai Chamber of Digital EconomyDigital economy
Customer: penn entertainmentGaming / Sports Entertainment
Workforce actions
8 companies with reported reductions
200 rolesAI driven restructure
27 rolescost reduction
Scale not stated rolesbusiness downturn
2 rolesrestructuring
Scale not stated rolescost reduction
Regulatory events
8 recorded events
approved for merger
pending regulatory approval
Cease-and-desist orders issued
Halting of Sweeps Coins offering in Mississippi and New JerseyMississippi and New Jersey regulators
Litigation
7 tracked suits
trademark dispute over the name \'Arena\'Regulatory · Verdict
Employment dispute over terminationCivil · Settled
Earnings pulse
Reported company results in the recorded window.
Median across 67 reported growth observations; companies may contribute multiple periods.
Mergers and acquisitions
Company-linked deal reports; status is preserved as recorded.
| Acquirer → target | Status | Date | Value / context |
|---|---|---|---|
| Canva→Simtheory | Announced | 2026-04-22 | Not stated in snapshot |
| Canva→ortto | Announced | 2026-04-22 | Not stated in snapshot |
| havas→Kaimera ↗ | Completed | 2026-04-17 | Not stated in snapshot |
| southern cross austereo→seven west media ↗ | Completed | 2026-04-17 | Not stated in snapshot |
| Canva→Doohly | Announced | 2026-04-10 | Not stated in snapshot |
| Canva→cavalry | Announced | 2026-04-10 | Not stated in snapshot |
A discussion or rumour is not a completed transaction. An unstated value is not zero.
PEOPLE & OPPORTUNITYThe talent market
Recorded hiring and workforce signals from the available source snapshot.
Expand panel +
The talent market
Recorded hiring and workforce signals from the available source snapshot.
Most advertised job titles
No repeated job title is supported by this snapshot.
0 tracked postings mention remote work.
Companies hiring
Large employers
| Company | Employees |
|---|---|
| tabcorp holdings limited ↗ | 5,000 |
| seven west media ↗ | 4,597 |
| hoyts ↗ | 3,000 |
| australian radio network ↗ | 2,410 |
| southern cross austereo ↗ | 1,612 |
| village roadshow pictures ↗ | 1,249 |
| envato ↗ | 698 |
| the lottery corporation ↗ | 685 |
THE PEOPLE BUILDING THE FIELDFounders and leaders
526 founders and chief executives across 434 companies.
Expand panel +
Founders and leaders
526 founders and chief executives across 434 companies.
Melanie Perkins
Canva ↗Co-Founder & CEO-Canva, Founder-Fusion Books
Daniel Simic
PlayUp ↗Playup, ex-Topbetta, ex-New Era, TAFE NSW, 1998
J Fiasson
Leonardo Ai ↗Co-Founder Raini Studios, ex-MD Loan Base, Cloud Business Technology, Engage Online. University of Sydney BLS 2006 & 2013
Nick Larkins
Qsic ↗Qsic, ex-Easy Control, ex-Bloomberg, RMIT University, 2006
Chris Richardson
Linius Technologies ↗Mirovoy Sales, C. W. Richardson & Associates, Ex-Piksel, KIT digital, U4EA Wireless, NextHop Technologies. University of Michigan
Dave R
Dabble ↗Ex -LRI Media Group, Kiewa Valley Engineering, Kiewa Valley Engineering. Swinburne University of Technology Master of Business Administration - MBA…
Stephen Phillips
Splash ↗CEO Mawson Ventures, Replic, ex- CEO We Are Hunted, Twitter. The University of Queensland BA 1993
Geoff Wellman
Virtually Human ↗EdApp, The University of Sydney Business School MBA 2019
Halim Yoo
Gamurs ↗Ex-TheFork · UNSW BS
Damon Oudejans
Picklebet ↗Co-Founder Puntaa & ex-Stepsie. Queensland University of Technology BS
Daniel Ronchi
DorsaVi ↗Ex-Director Pro-Active Industries Pty Ltd. Southern Cross University Associate Degree in Law 1997
Lauren Clinnick
Lumi interactive ↗Lumi Interactive, ex-Lumi Consulting, ex-House Communications, Swinburne University of Technology, 2012
Education networks
25 profiles with education records.
Prior employers
5 profiles with prior-work records.
Profiles cover recorded founders and leaders; contact details remain in Radar.
NEWS INTELLIGENCEHow this industry appears in the news
644,273 articles in the measured 12-month window.
Expand panel +
How this industry appears in the news
644,273 articles in the measured 12-month window.
News volume trends
Media & Entertainment coverage across Australia · articles per complete quarter
View quarterly article counts
| Quarter | Articles |
|---|---|
| 2021Q2 | 106,105 |
| 2021Q3 | 120,515 |
| 2021Q4 | 107,686 |
| 2022Q1 | 122,607 |
| 2022Q2 | 117,435 |
| 2022Q3 | 125,489 |
| 2022Q4 | 172,983 |
| 2023Q1 | 190,505 |
| 2023Q2 | 133,184 |
| 2023Q3 | 151,923 |
| 2023Q4 | 143,344 |
| 2024Q1 | 140,005 |
| 2024Q2 | 147,846 |
| 2024Q3 | 149,080 |
| 2024Q4 | 163,338 |
| 2025Q1 | 190,446 |
| 2025Q2 | 127,097 |
| 2025Q3 | 225,761 |
| 2025Q4 | 115,385 |
| 2026Q1 | 126,127 |
Article volume measures coverage, not market sales.
Tone of coverage over time
Most-covered companies
Company share of voice
675 recorded company events across 49 companies; percentages use that event total.
Leading coverage topics
Media & Entertainment coverage across Australia · ranked by full-period article count.
Recent and prior counts use the source comparison windows.
Topics gaining and losing attention
Media & Entertainment coverage across Australia
| Keyword | Recent | Prior | Change |
|---|---|---|---|
| countries | 3,723 | 1,788 | 108% |
| domestic robots | 2,261 | 39 | 5697% |
| toy robots | 2,244 | 28 | 7914% |
| ashes moments | 1,095 | 707 | 55% |
| conceptual rock albums | 1,014 | 33 | 2973% |
| angel investors | 950 | 348 | 173% |
| overseas study | 904 | 630 | 43% |
| ashes urn | 828 | 364 | 127% |
| ashes records | 787 | 371 | 112% |
| semester abroad | 761 | 485 | 57% |
| test cricket | 5,569 | 10,699 | -48% |
| test innings | 4,232 | 8,213 | -48% |
| 5-day cricket | 3,470 | 7,201 | -52% |
| odi cricket | 2,732 | 5,722 | -52% |
| limited overs cricket | 2,608 | 5,675 | -54% |
Event and signal lenses
Media & Entertainment coverage across Australia
Regulatory Risk
1,113,209 classified articlesterritories, disputed islands, test cricket
27.5% critical · 20.1% positiveFunding Momentum
151,713 classified articlestest cricket, test innings, odi world cup
31.2% critical · 43.0% positiveGrowth
175,781 classified articlesnba expansion teams, nba team legends, league expansion news
31.6% critical · 46.7% positiveMedia & Entertainment coverage across Australia. Topic labels describe recorded classifications and can include broad context.
DEMAND, SUPPLY & PLACEWhere demand signals run ahead of mapped supply — Australia
Compare demand signals in Australia’s newsflow with the media & entertainment categories mapped to each signal.
Expand panel +
Where demand signals run ahead of mapped supply — Australia
Compare demand signals in Australia’s newsflow with the media & entertainment categories mapped to each signal.
Signal percentile − supply percentile = gap in percentile points. Positive gaps highlight questions to investigate. A high signal can reflect spending pressure or access friction, as well as potential demand.
The comparison is relative to the signal families on this page. A supply percentile of zero means the lowest relative reading, not zero companies. It is a prioritisation clue, not measured market size or unmet demand.
The opportunity, in one view
Signal and mapped-supply percentiles, their gap, and change in the signal’s article share.
Swipe horizontally to compare all columns →
| Signal family | Signal percentile | Supply percentile | Relative gap | Gap (points) | Signal share vs prior year |
|---|---|---|---|---|---|
| Streaming & OTT ↗Adoption Shift | 75.0 | 0.0 | +75.0 | +43.5% | |
| Layoffs & income shocks ↗Spending Pressure | 75.0 | 50.0 | +25.0 | +94.9% | |
| Creator economy ↗Demand Driver | 0.0 | 100.0 | -100.0 | +4.1% |
Showing all 3 signals. Select a family for its history and mapped categories.
Where the signals are loudest
All 8 city readings for these demand families in the comparison geography. Australia is highlighted.
Each city’s reading is a share of its own coverage.
Streaming & OTT · Layoffs & income shocks
Creator economy · Streaming & OTT · Layoffs & income shocks
Streaming & OTT · Layoffs & income shocks · Creator economy
Layoffs & income shocks · Streaming & OTT
Streaming & OTT · Layoffs & income shocks · Creator economy
Layoffs & income shocks · Streaming & OTT · Creator economy
Streaming & OTT · Layoffs & income shocks · Creator economy
Layoffs & income shocks · Streaming & OTT · Creator economy
Inside the leading signals
Open any signal for its quarterly historyADOPTION SHIFTStreaming & OTT+75.0percentile-point gap
Streaming adoption can pull content, platform and monetisation demand with it.
Mapped media & entertainment categories
- Video On Demand42
Companies can appear in multiple categories; these counts are not a unique-company total.
Quarterly share of Australia coverage
Mentions per 10,000 articles · zero baseline
View quarterly signal counts
| Quarter | Mentions | Per 10,000 articles |
|---|---|---|
| 2024Q3 | 91 | 13.5 |
| 2024Q4 | 171 | 21.74 |
| 2025Q1 | 144 | 18.23 |
| 2025Q2 | 93 | 15.93 |
| 2025Q3 | 257 | 31.24 |
| 2025Q4 | 107 | 18.62 |
| 2026Q1 | 107 | 17.63 |
Where this signal concentrates in the comparison geography
SPENDING PRESSURELayoffs & income shocks+25.0percentile-point gap
Layoff cycles can pull discretionary spend back toward value offerings.
Mapped media & entertainment categories
- Real Money Gaming98
Companies can appear in multiple categories; these counts are not a unique-company total.
Quarterly share of Australia coverage
Mentions per 10,000 articles · zero baseline
View quarterly signal counts
| Quarter | Mentions | Per 10,000 articles |
|---|---|---|
| 2024Q3 | 88 | 13.05 |
| 2024Q4 | 101 | 12.84 |
| 2025Q1 | 96 | 12.15 |
| 2025Q2 | 61 | 10.45 |
| 2025Q3 | 215 | 26.14 |
| 2025Q4 | 105 | 18.27 |
| 2026Q1 | 154 | 25.37 |
Where this signal concentrates in the comparison geography
DEMAND DRIVERCreator economy-100.0percentile-point gap
Creator activity can pull tooling, monetisation and brand-deal demand around it.
Mapped media & entertainment categories
- Internet First News Publishers88
- Internet First Sports Media57
Companies can appear in multiple categories; these counts are not a unique-company total.
Quarterly share of Australia coverage
Mentions per 10,000 articles · zero baseline
View quarterly signal counts
| Quarter | Mentions | Per 10,000 articles |
|---|---|---|
| 2024Q3 | 34 | 5.04 |
| 2024Q4 | 65 | 8.26 |
| 2025Q1 | 63 | 7.97 |
| 2025Q2 | 30 | 5.14 |
| 2025Q3 | 46 | 5.59 |
| 2025Q4 | 67 | 11.66 |
| 2026Q1 | 34 | 5.6 |
Where this signal concentrates in the comparison geography
RESEARCH & CHANGING CONVERSATIONSRelated research and changing coverage
Australia media & entertainment coverage
Expand panel +
Related research and changing coverage
Australia media & entertainment coverage
The patriotism down under: Nationalized qualities and Australian media consumption of the 2016 Rio Olympic Games
International Review for the Sociology of Sport
14 citations in the snapshot
Access for everyone? Australia’s ‘streaming wars’ and consumers with disabilities
Continuum
6 citations in the snapshot
What is ‘children’s television’ in the streaming era?: Assessing content discoverability through Australian children’s streaming platform fluencies
Convergence The International Journal of Research into New Media Technologies
5 citations in the snapshot
What is growing in this coverage
Australia coverage of this page's demand families
| Keyword | Recent articles | Prior articles | Share change |
|---|
Share changes describe coverage in the stated comparison periods, not search demand or market size.
GEOGRAPHIC FOOTPRINTWhere companies are based
Company counts, hiring and disclosed funding across the recorded hubs.
Expand panel +
Where companies are based
Company counts, hiring and disclosed funding across the recorded hubs.

Sydney
448 companies39.9% across the displayed hubs
8 companies hiring · $2.4B disclosed funding
Explore companies in Sydney ↗
Melbourne
356 companies31.7% across the displayed hubs
6 companies hiring · $83.5M disclosed funding
Explore companies in Melbourne ↗
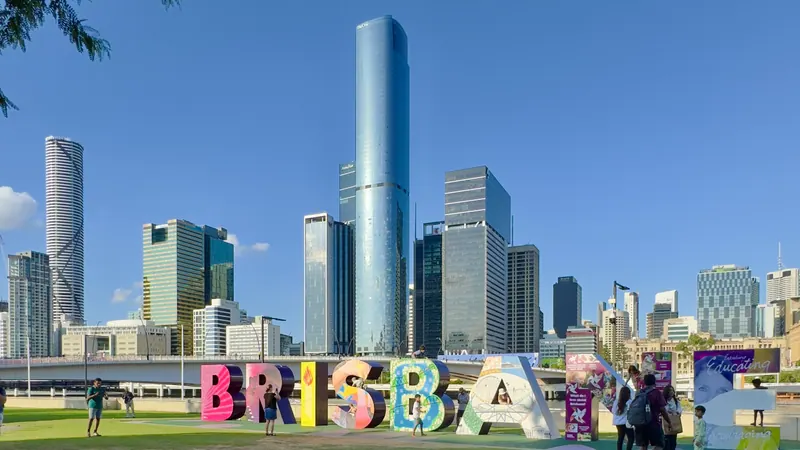
Brisbane
131 companies11.7% across the displayed hubs
4 companies hiring · $24.7M disclosed funding
Explore companies in Brisbane ↗
Perth
81 companies7.2% across the displayed hubs
0 companies hiring · $456.6M disclosed funding
Explore companies in Perth ↗
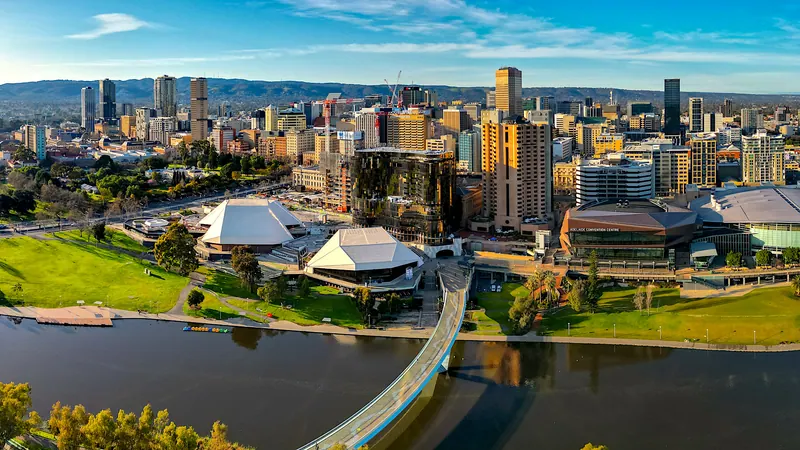
Adelaide
42 companies3.7% across the displayed hubs
2 companies hiring · $1.3M disclosed funding
Explore companies in Adelaide ↗Surry Hills
31 companies2.8% across the displayed hubs
0 companies hiring · $653.2M disclosed funding
Explore companies in Surry Hills ↗
Canberra
18 companies1.6% across the displayed hubs
0 companies hiring · $450.0K disclosed funding
Explore companies in Canberra ↗Gold Coast
16 companies1.4% across the displayed hubs
0 companies hiring · $130.5M disclosed funding
Explore companies in Gold Coast ↗Media & Entertainment in Australia: key questions
Clear definitions for making better comparisons.
What does this landscape measure?
It measures the tracked company ecosystem, recorded funding, hiring and other available evidence. It is not a market-size estimate.
Can segment counts be added together?
No. A company can belong to several segments, so segment counts and funding can overlap.
What does a missing figure mean?
A dash or unavailable panel means the current reviewed source snapshot does not support that figure.
Company ecosystem snapshot: 6 August 2026. Funding is recorded in USD; filed accounts retain their stated currency and reporting basis. Each section identifies its own coverage. The news and research behind these sections is explorable in Prism.
Canonical landscape ↗